¶ Quick Start
By default, Metalogi MetaStudio comes with a Community License. The product is fully functional and is free of charge for any user. MetaStudio is a great tool for monitoring and managing MTConnect agents. We would like to continue to develop this tool to promote the MTConnect standard and to streamline its integration with other common industrial protocols.
We also offer support licenses and advanced features. After purchase, you will be given a license key. This license key can be entered under Help > License.
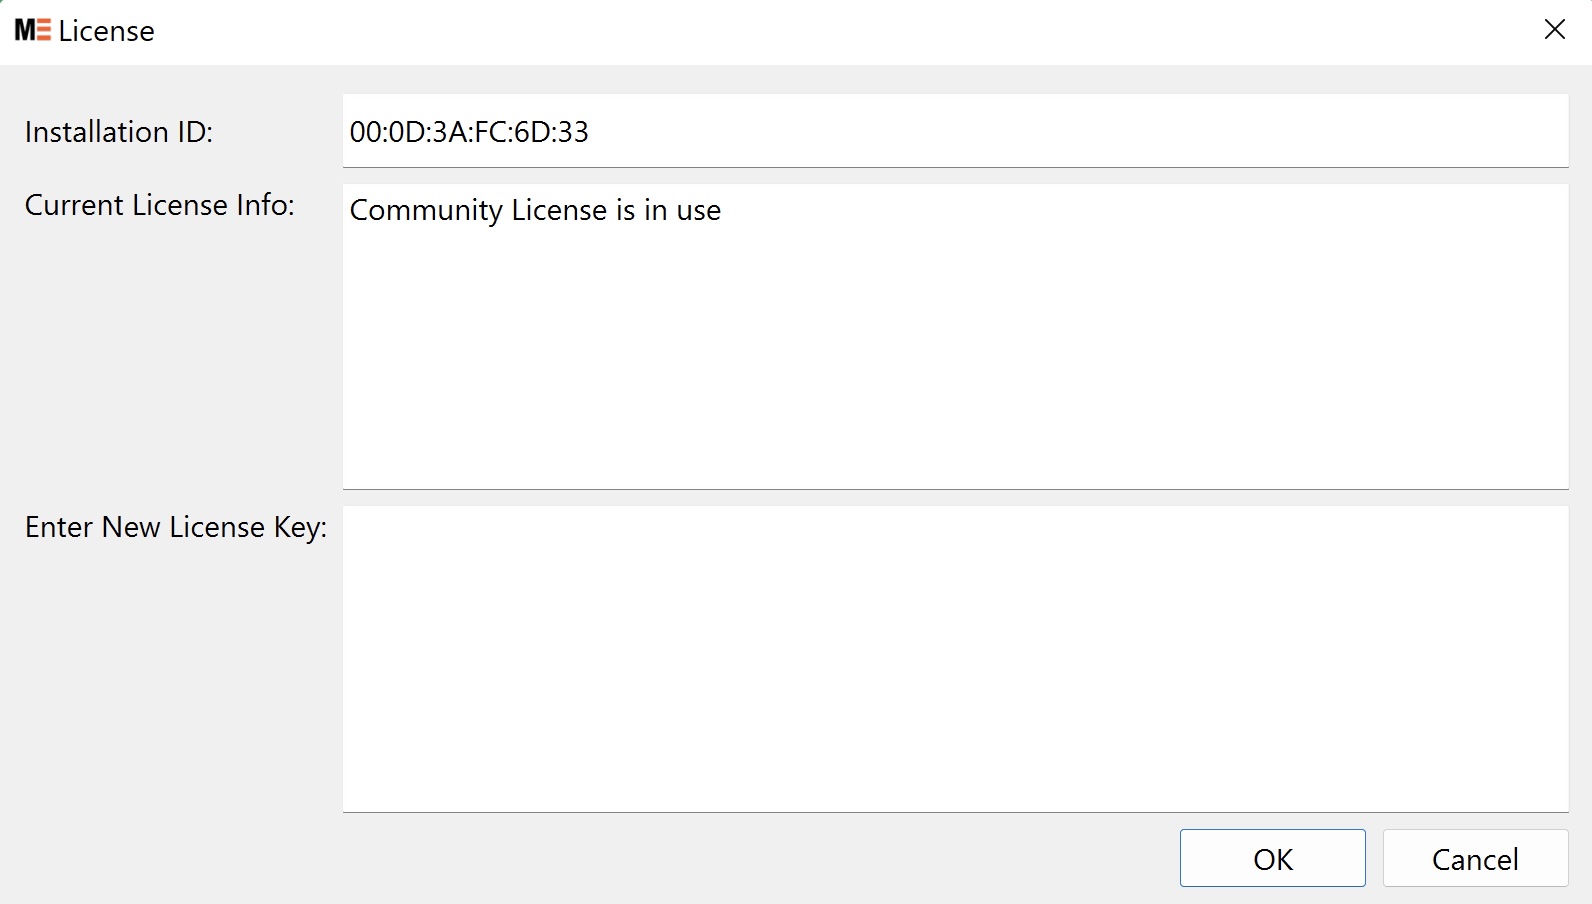
Entering a provided license should immediately update the given license information to reflect the type of license and expiration date.
¶ Additional Video Info
https://www.youtube.com/channel/UCktM-DGv2n2NVvelAoYZe2Q
¶ General User Interface Layout
Each MetaStudio window has these main areas in the user interface:
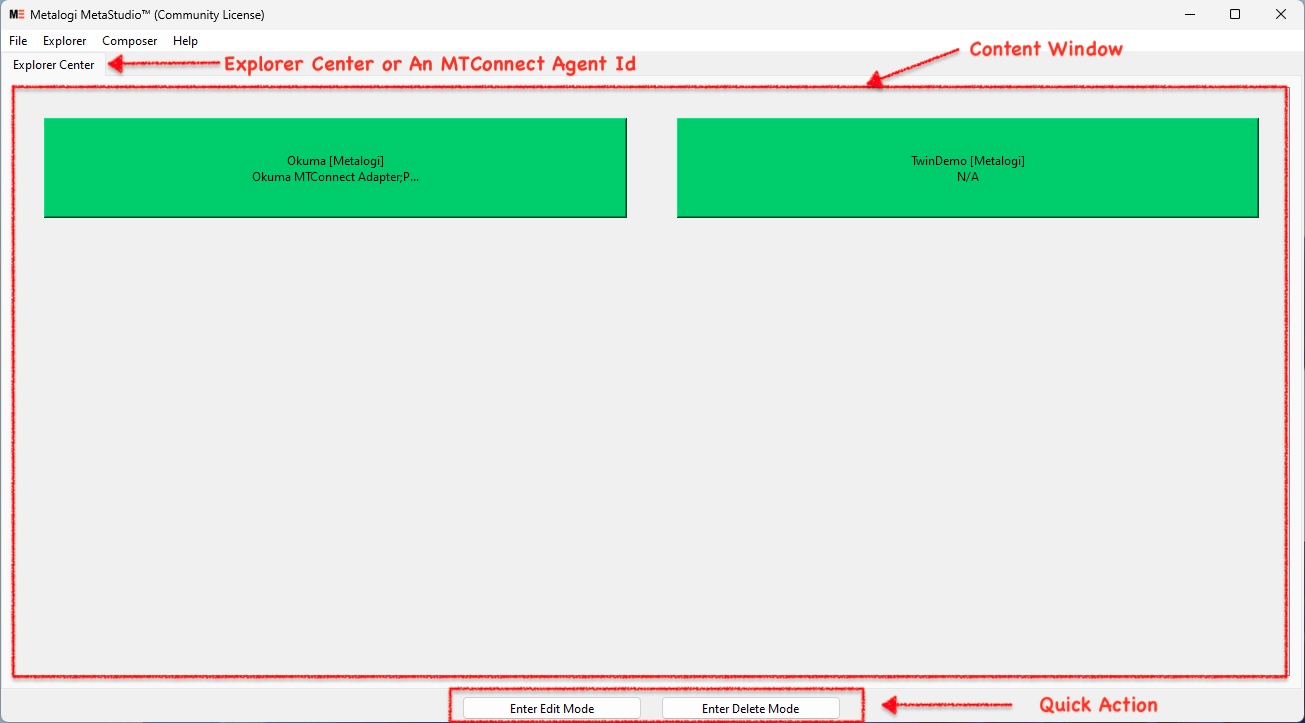
- Content Window - Display the content for the Explorer Center or Device Monitor/Editor Tab.
- Quick Actions - Allow quick actions to perform the most common tasks for the current display.
¶ MetaStudio Windows
MetaStudio consists of these Windows:
- Explorer Center Window - Configure the connections to the MTConnect agents for the machines. After the setup, you can use this to launch the agent's Device Monitor display.
- Device Monitor Window - Monitor the data items in the MTConnect agent
- Device Editor Window - Configure a device and test run the configuration using a local MTConnect agent
MetaStudio opens the Exloprer Center Window on startup and you can launch individual Device Monitor/Editor Window for the selected MTConnect agent.
¶ Explorer Center Window
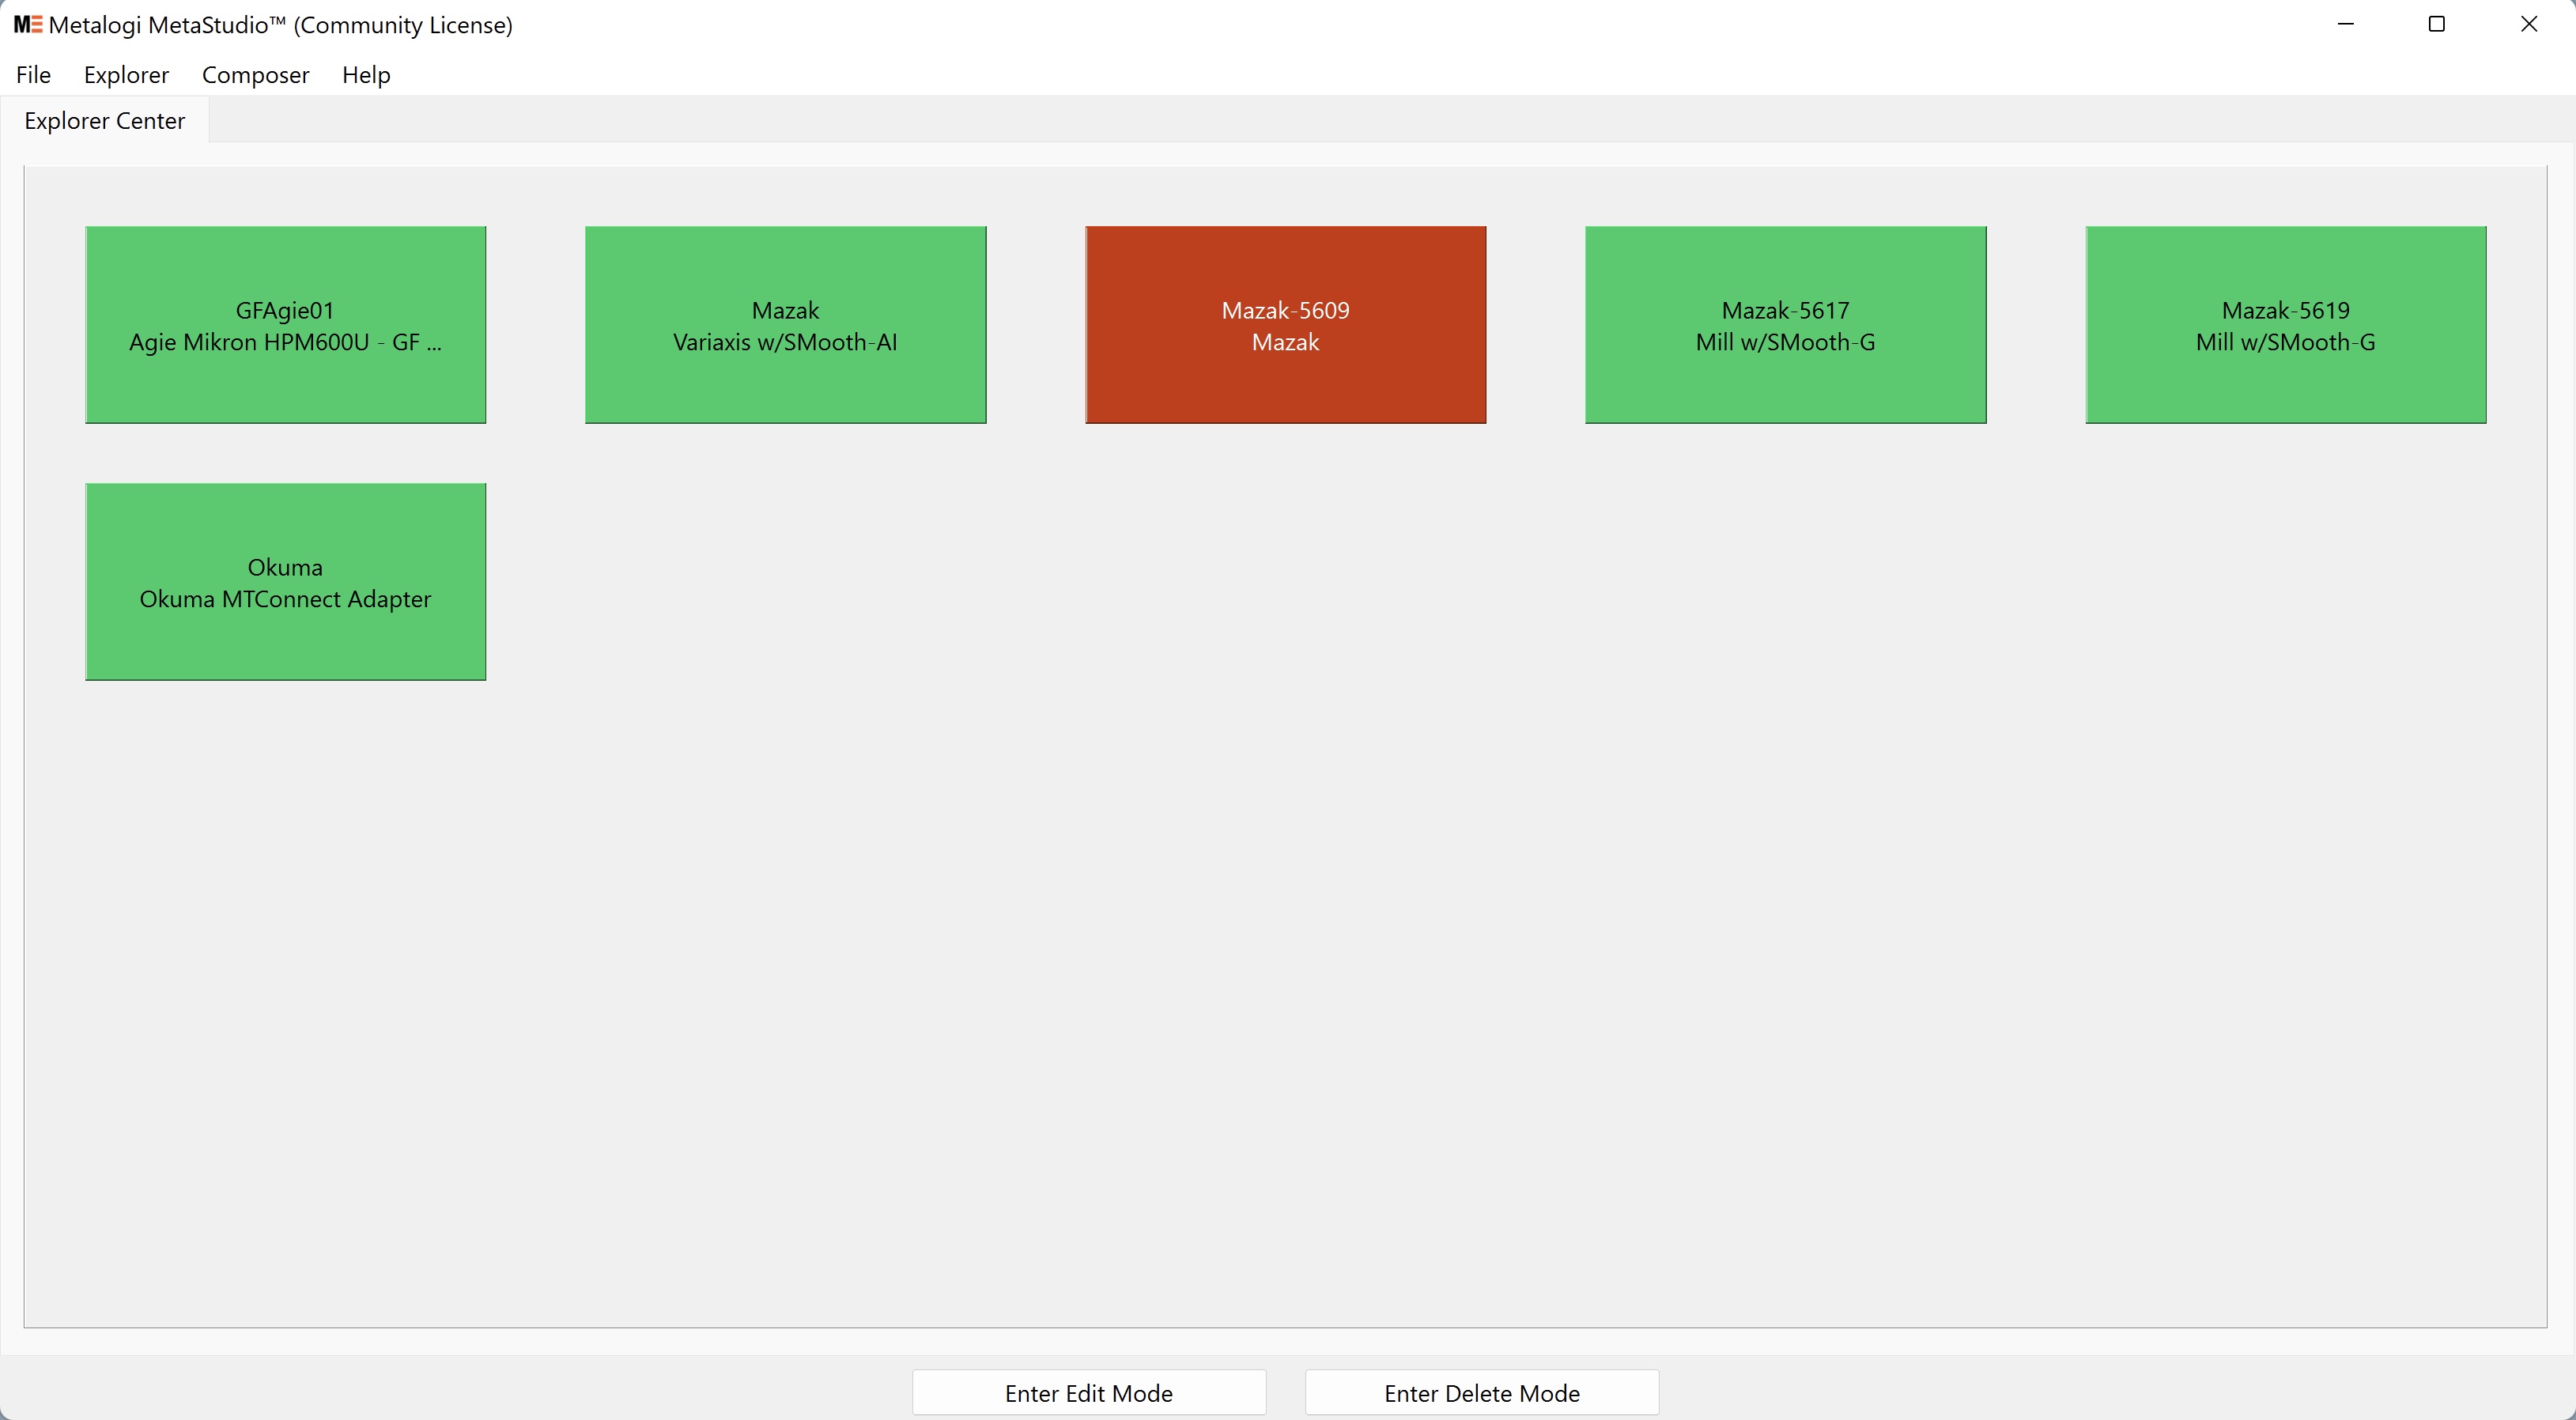
The Explorer Center displays all configured MTConnect agents' connections and allows a quick view of their availability; green represents an available agent, while red represents an unavailable agent. An agent's status may be greyed out if its agent cannot be connected.
After adding several MTConnect agents, the Explorer Center might look something like this:
The Explorer Center can be navigated at any time by selecting the “Explorer Center” tab button at the top of the screen.
¶ Adding a Machine
If you wish to edit/add an MTConnect agent for a machine at any time, this screen can be reached under Explorer > Enter Edit Mode.
To add a new agent for this machine, select the “Add New” bar at the top. A popup will appear:
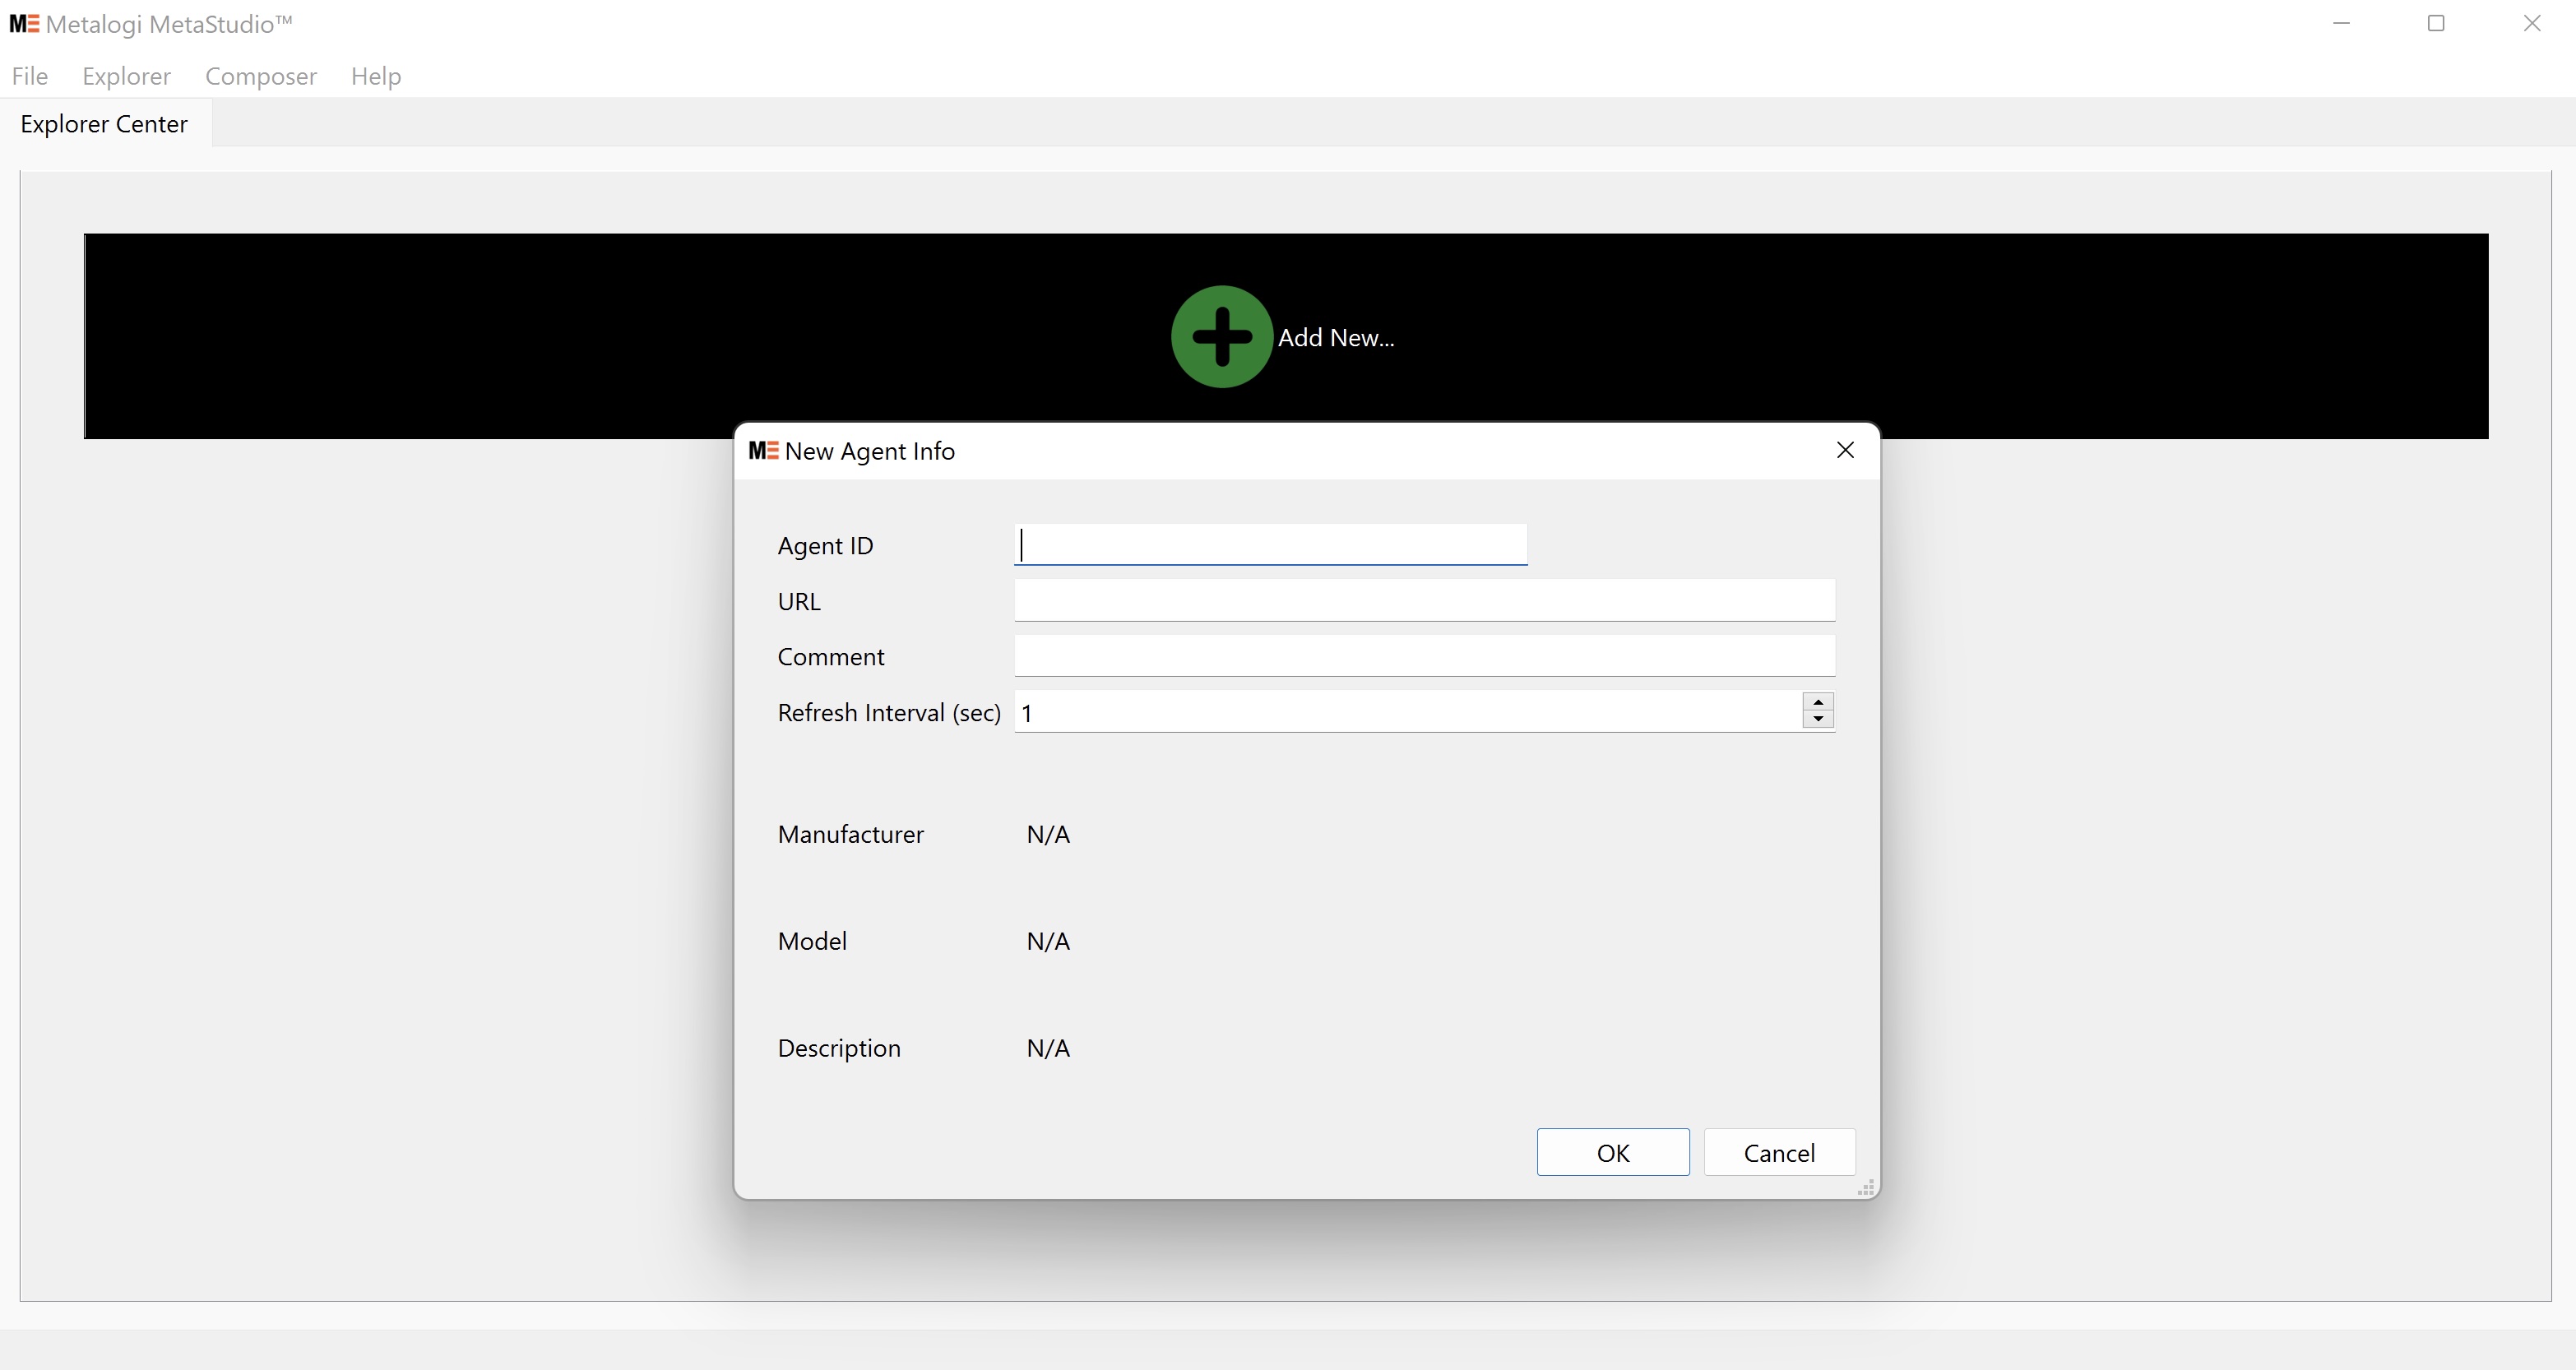
The Agent ID is simply whatever name you wish to refer to the machine by; the URL is the URL of the MTConnect agent you wish to connect to. A valid URL will allow MetaStudio to contact the agent, which will update the Manufacturer, Model, and Description fields:
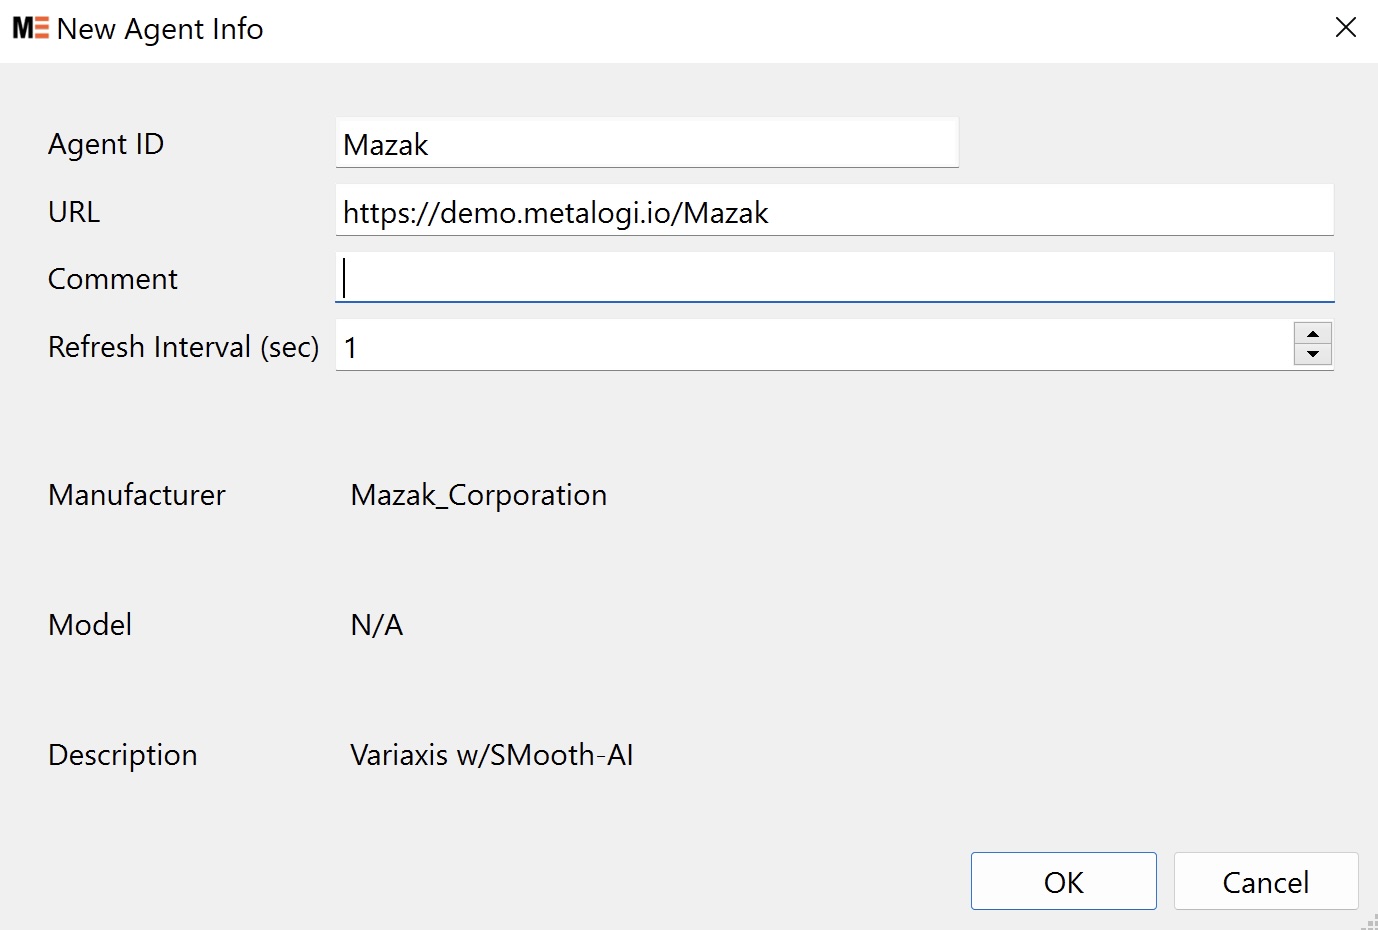
The refresh interval is the time between machine polls; for example, the default refresh interval of one second means that MetaStudio will poll the machine every 1 second.
Select OK on the pop-up to add the machine. The resulting screen should look something like this.
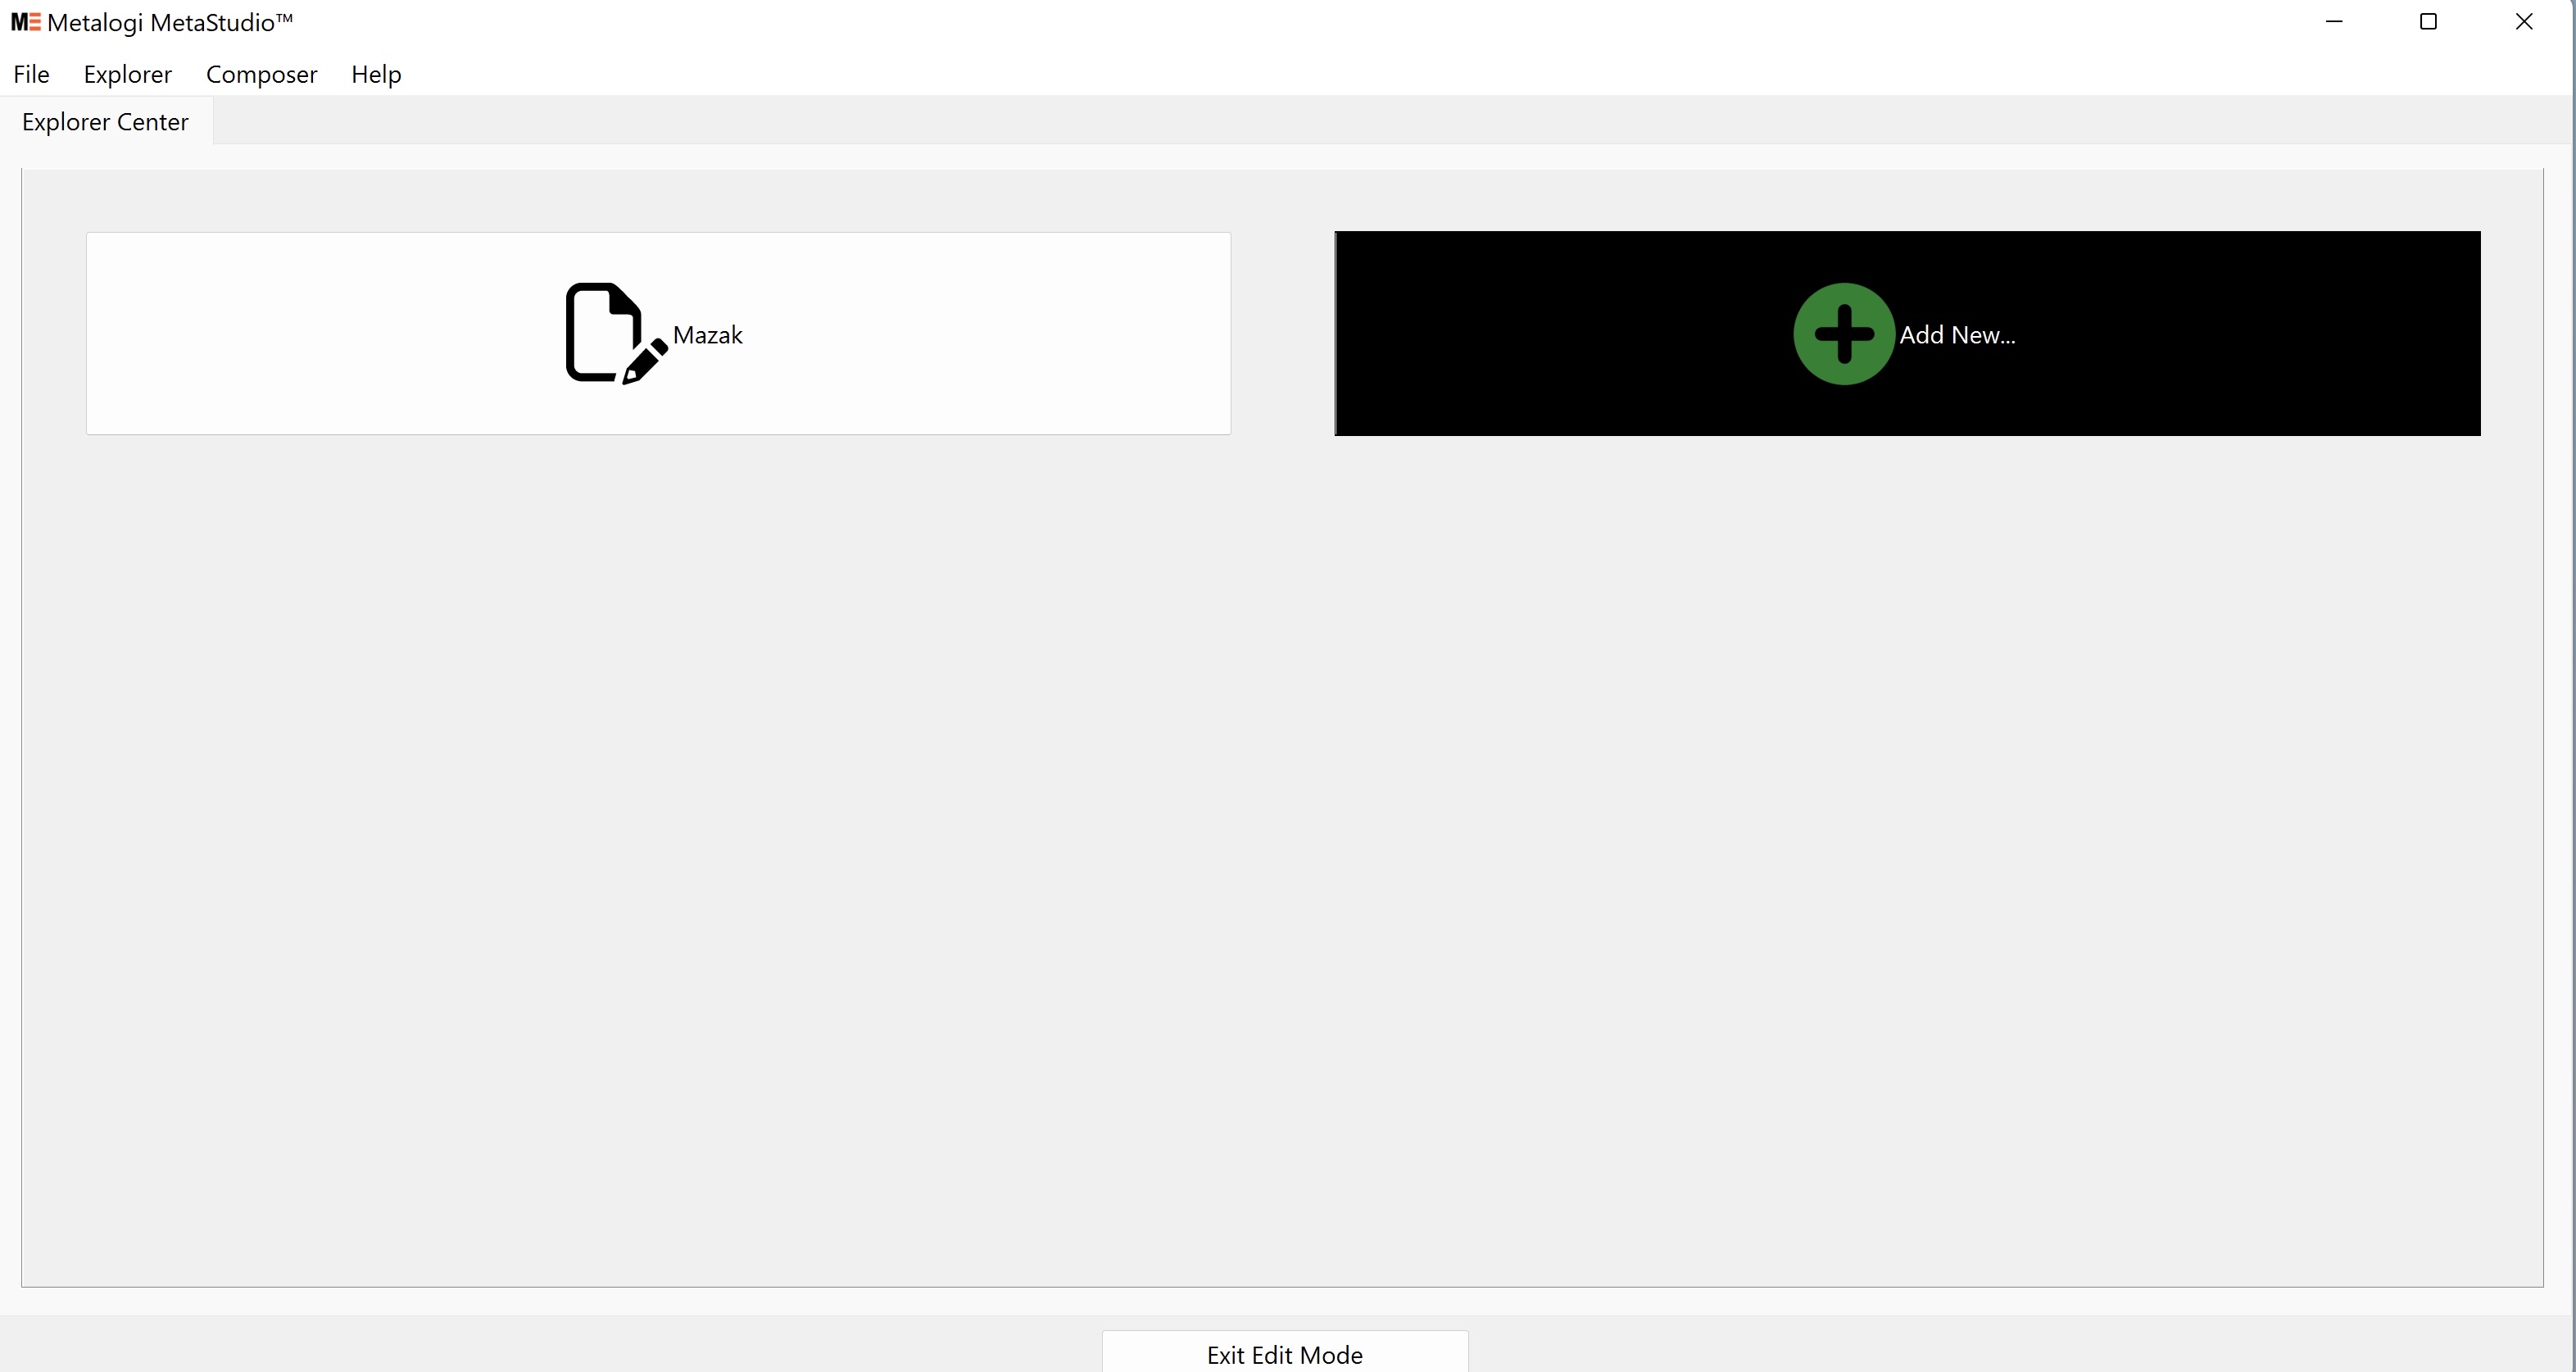
You may add multiple agents at this time by repeating the “Add New” process for each machine, or you may edit the agent's information by selecting the corresponding button for that machine. Once you are done, select Explorer > Exit Edit Mode.
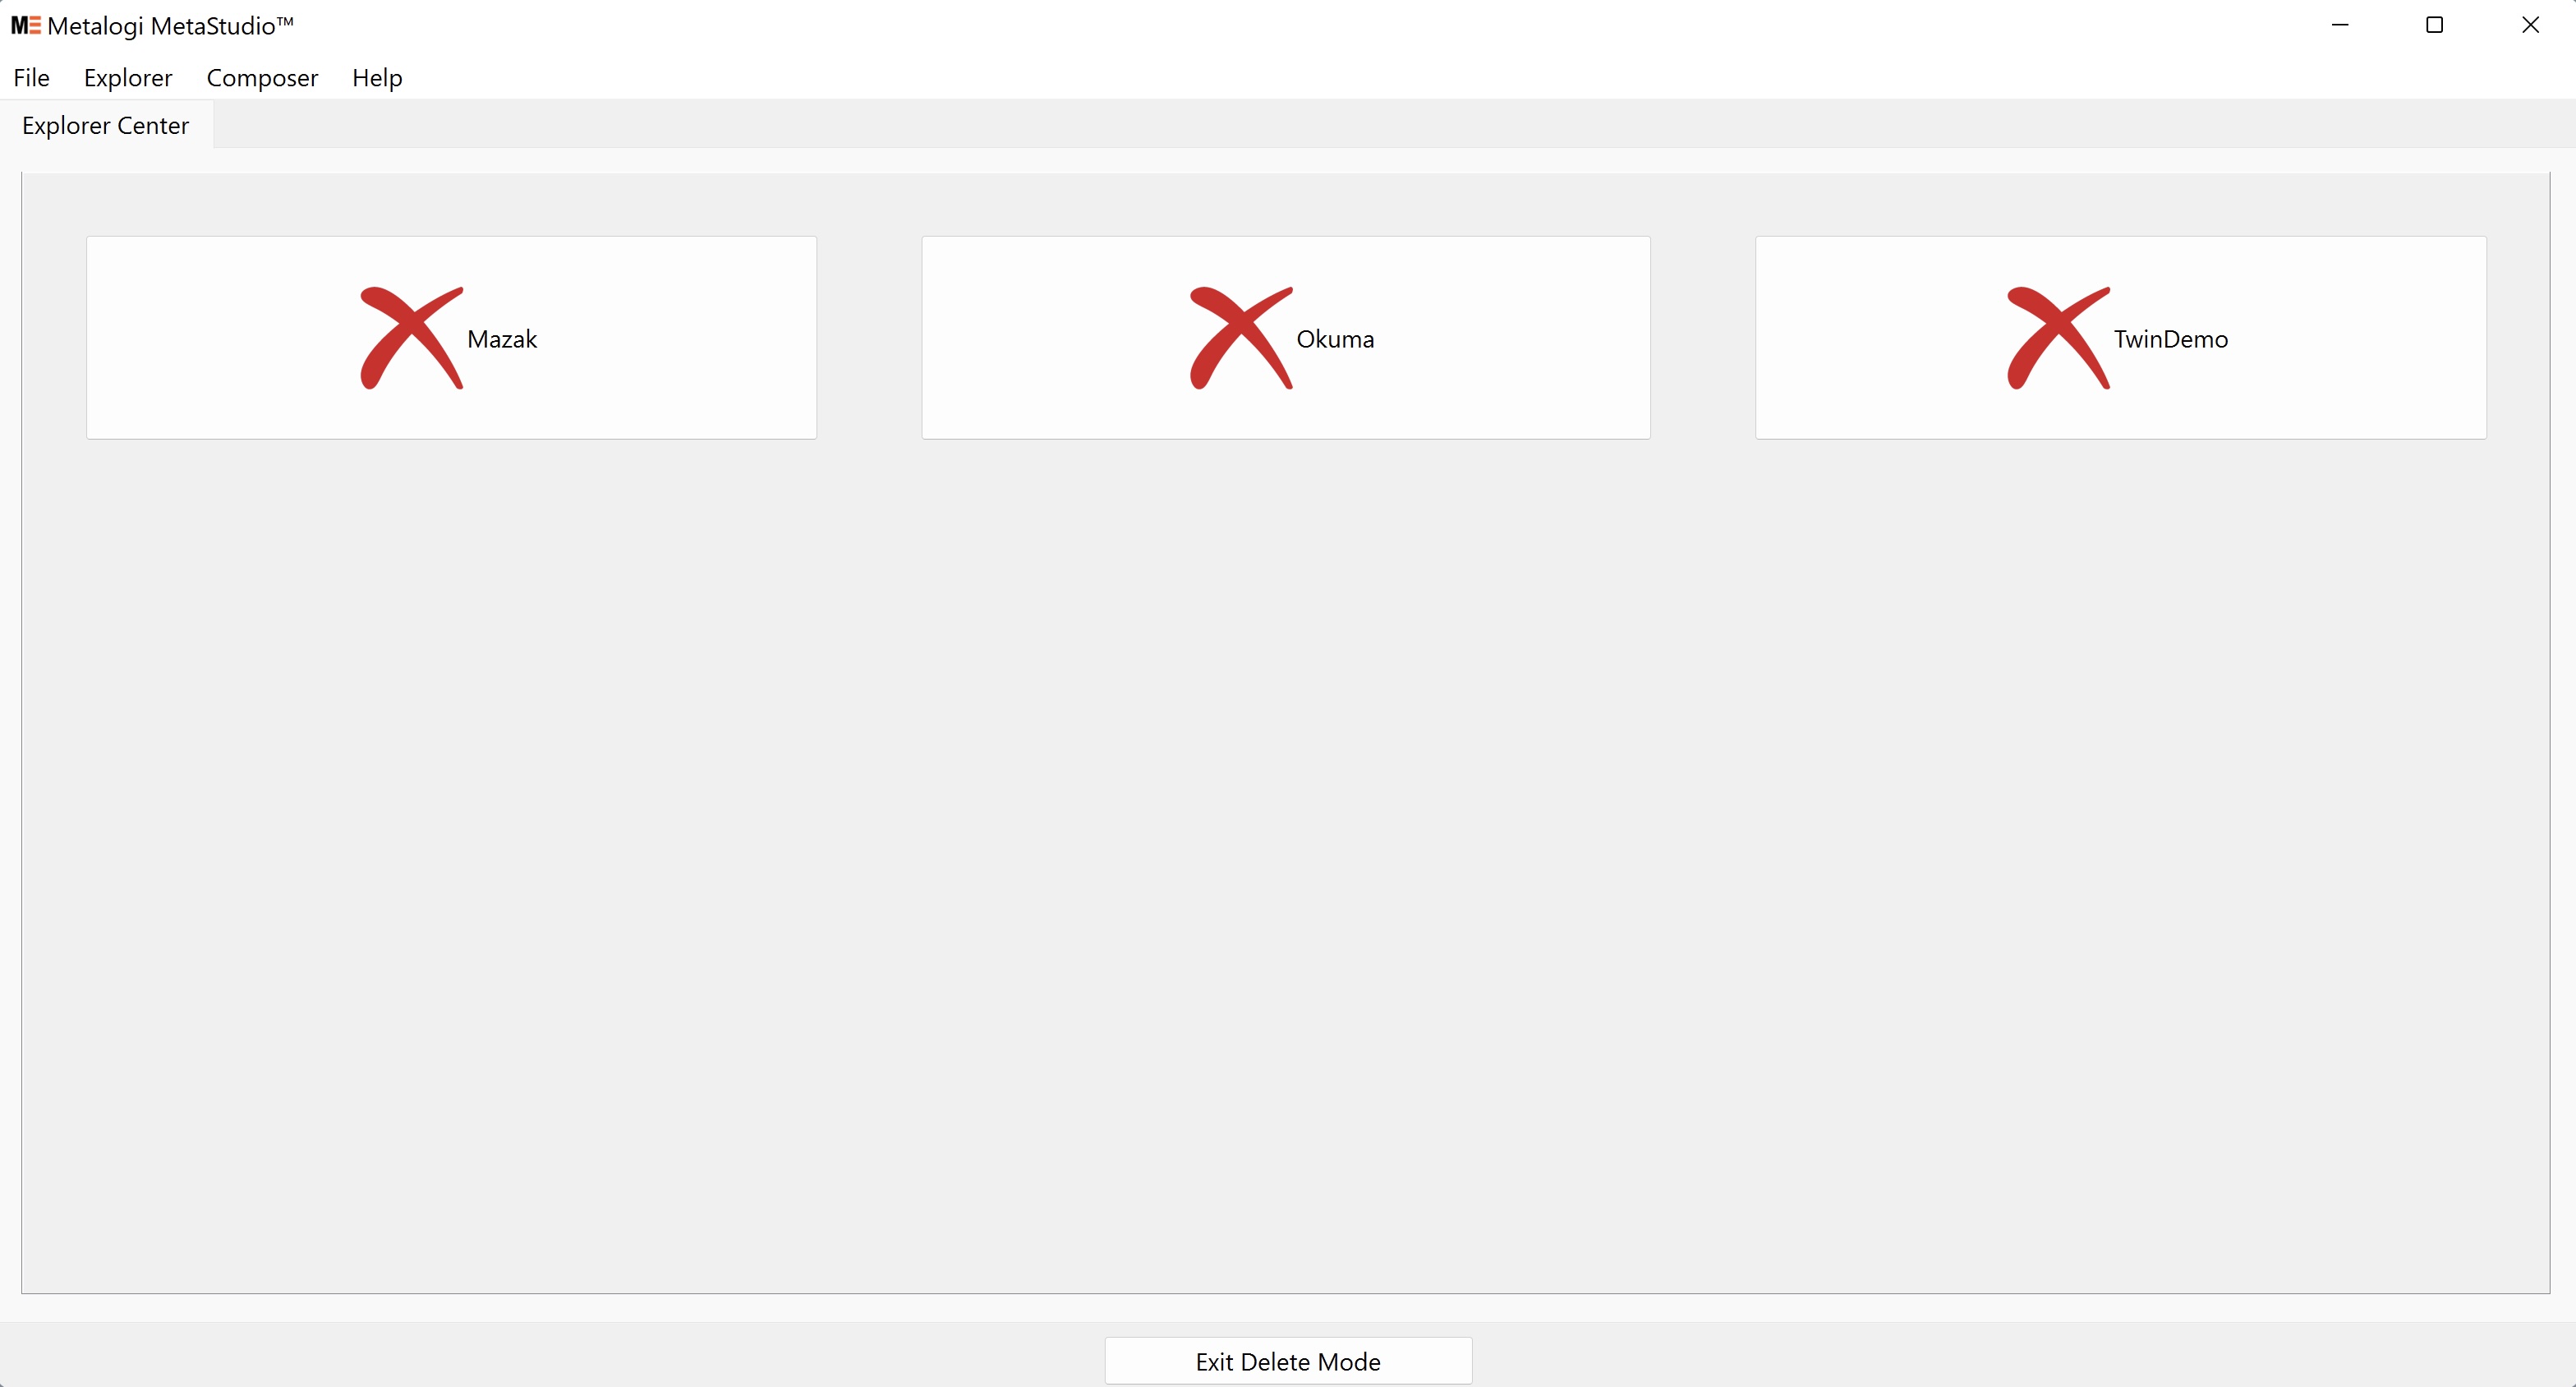
¶ Deleting a Machine
To remove the connection for a machine, select Explorer > Enter Delete Mode. This will bring up a list of all MTConnect agents' connections. For each connection you wish to delete, select the button corresponding to the connection and answer the confirmation popup. Select Explorer > Exit Delete Mode when you are finished.
¶ Device Monitor Window
From the Explorer Center Window, you can click on any button for an Agent. Then it will launch a Device Monitor Window and display the current real-time data from the machine provided by this agent.
¶ Overview
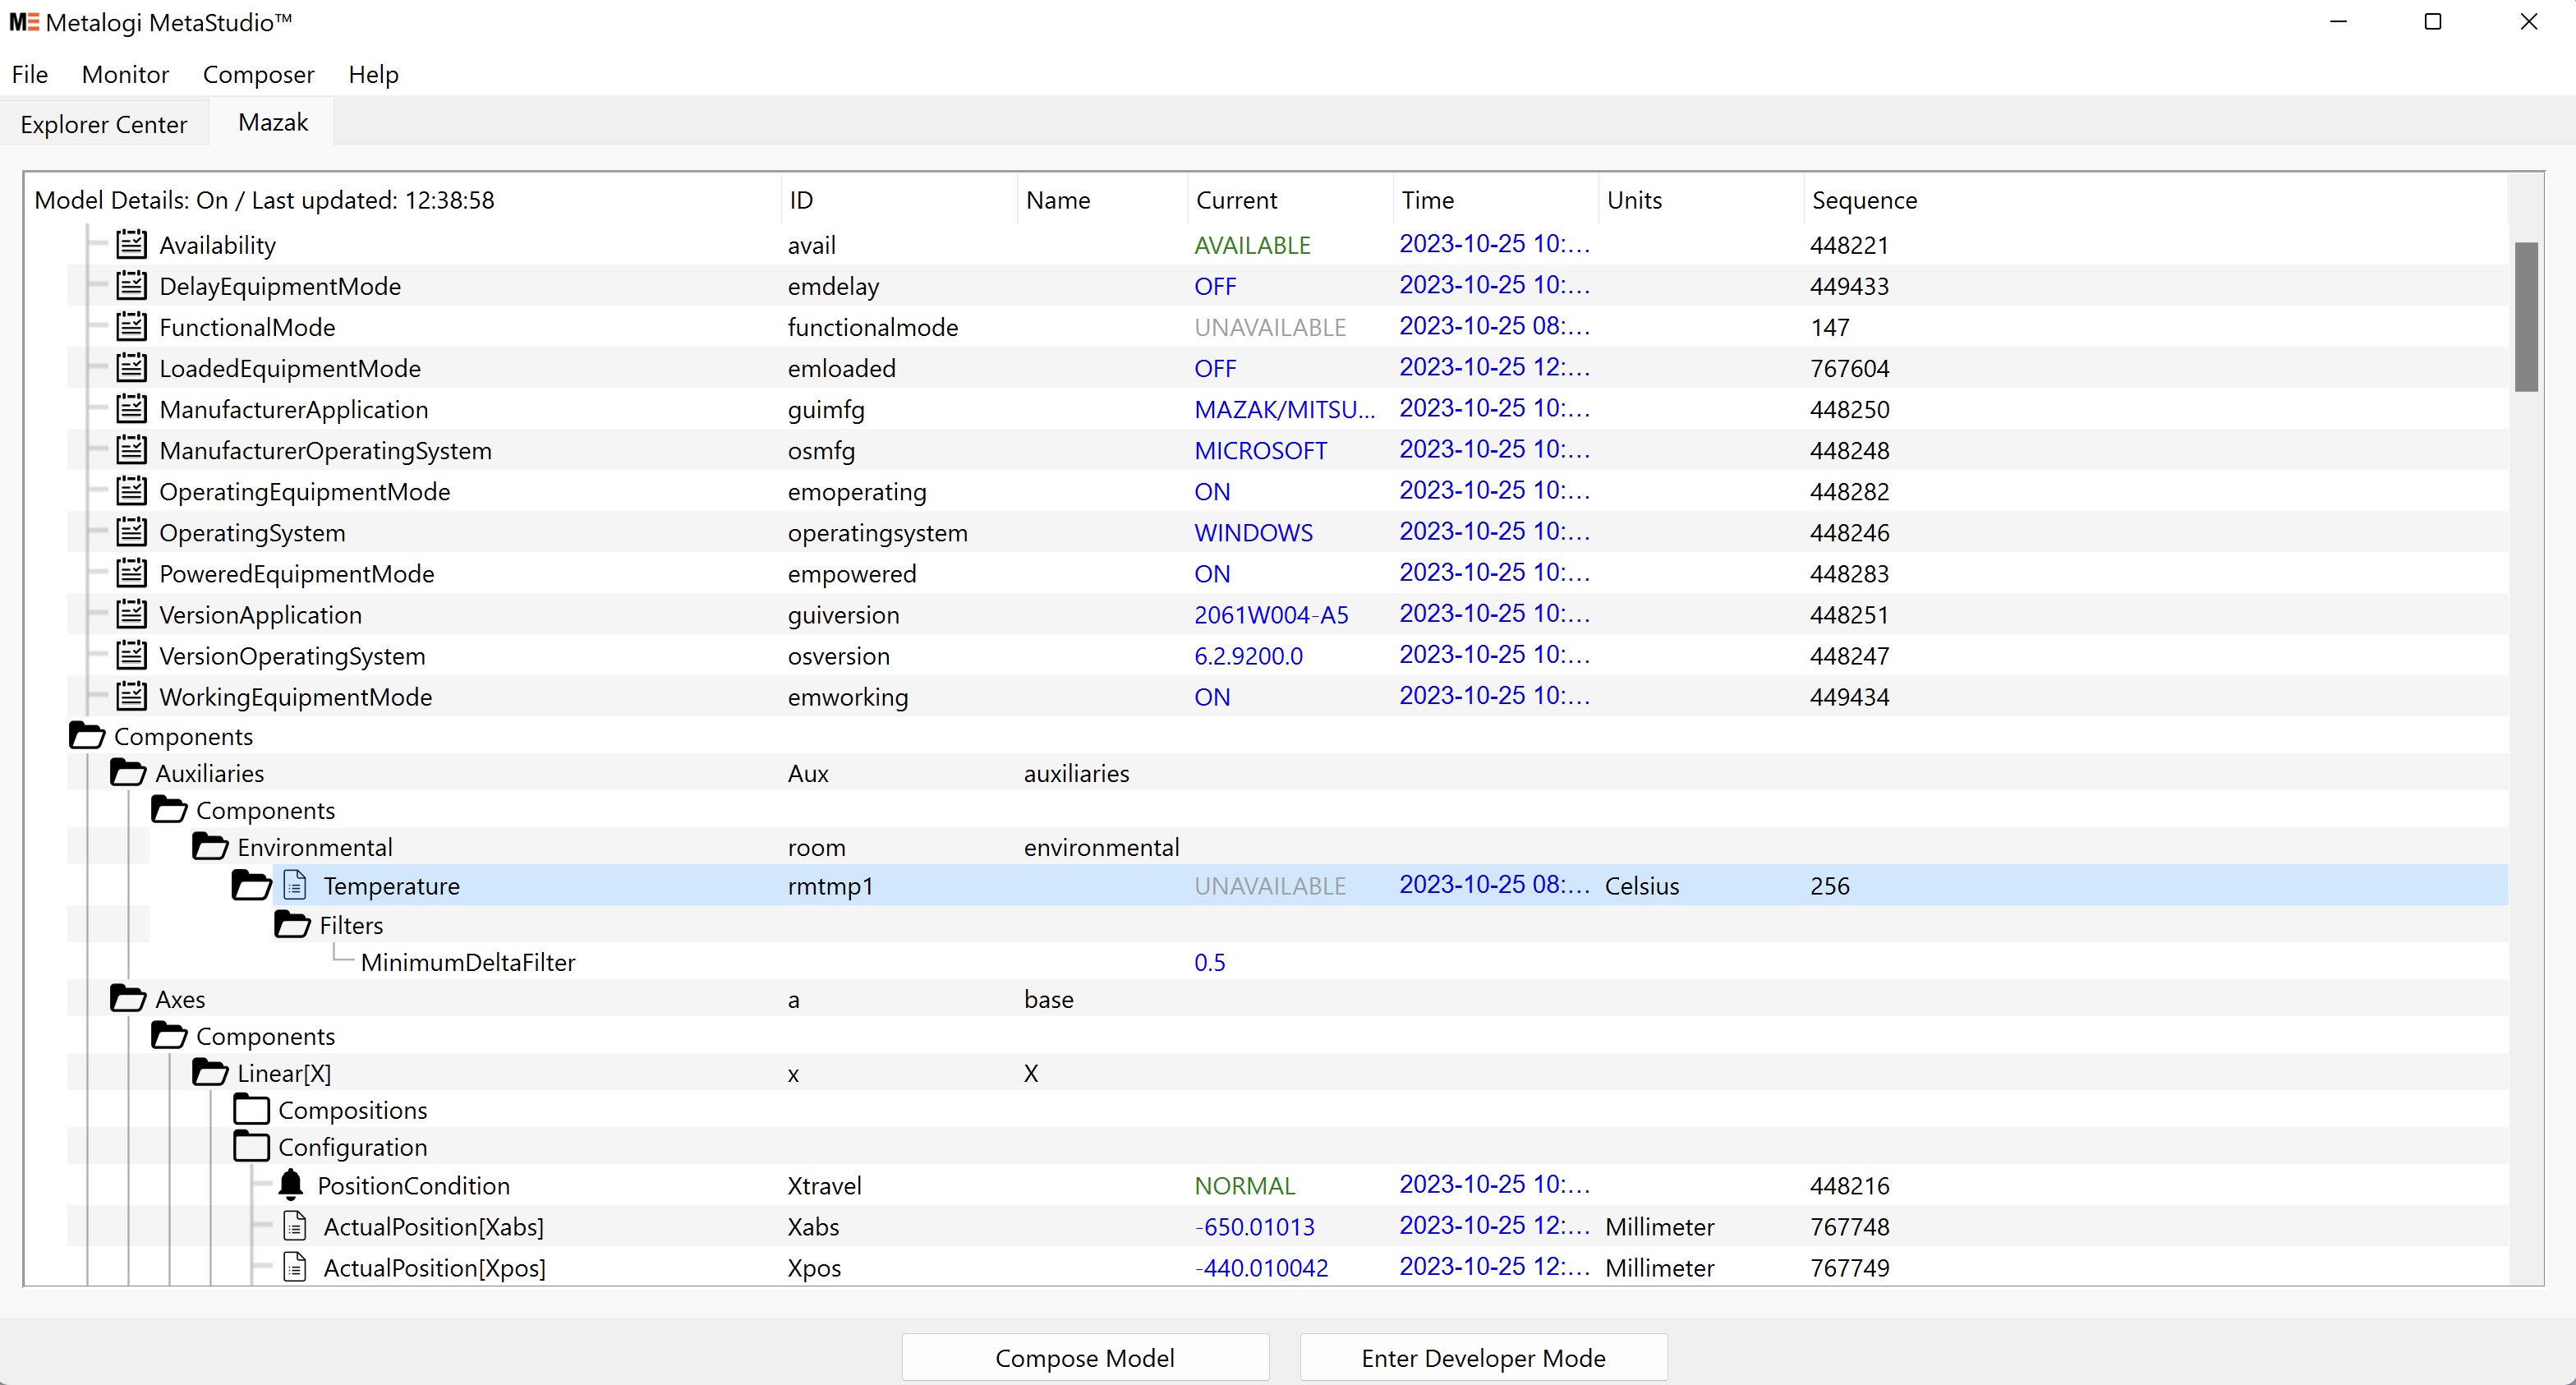
The Device Monitor Window displays all information collected from the MTConnect agent, including timestamps and units for each data field. An information summary might look something like this:
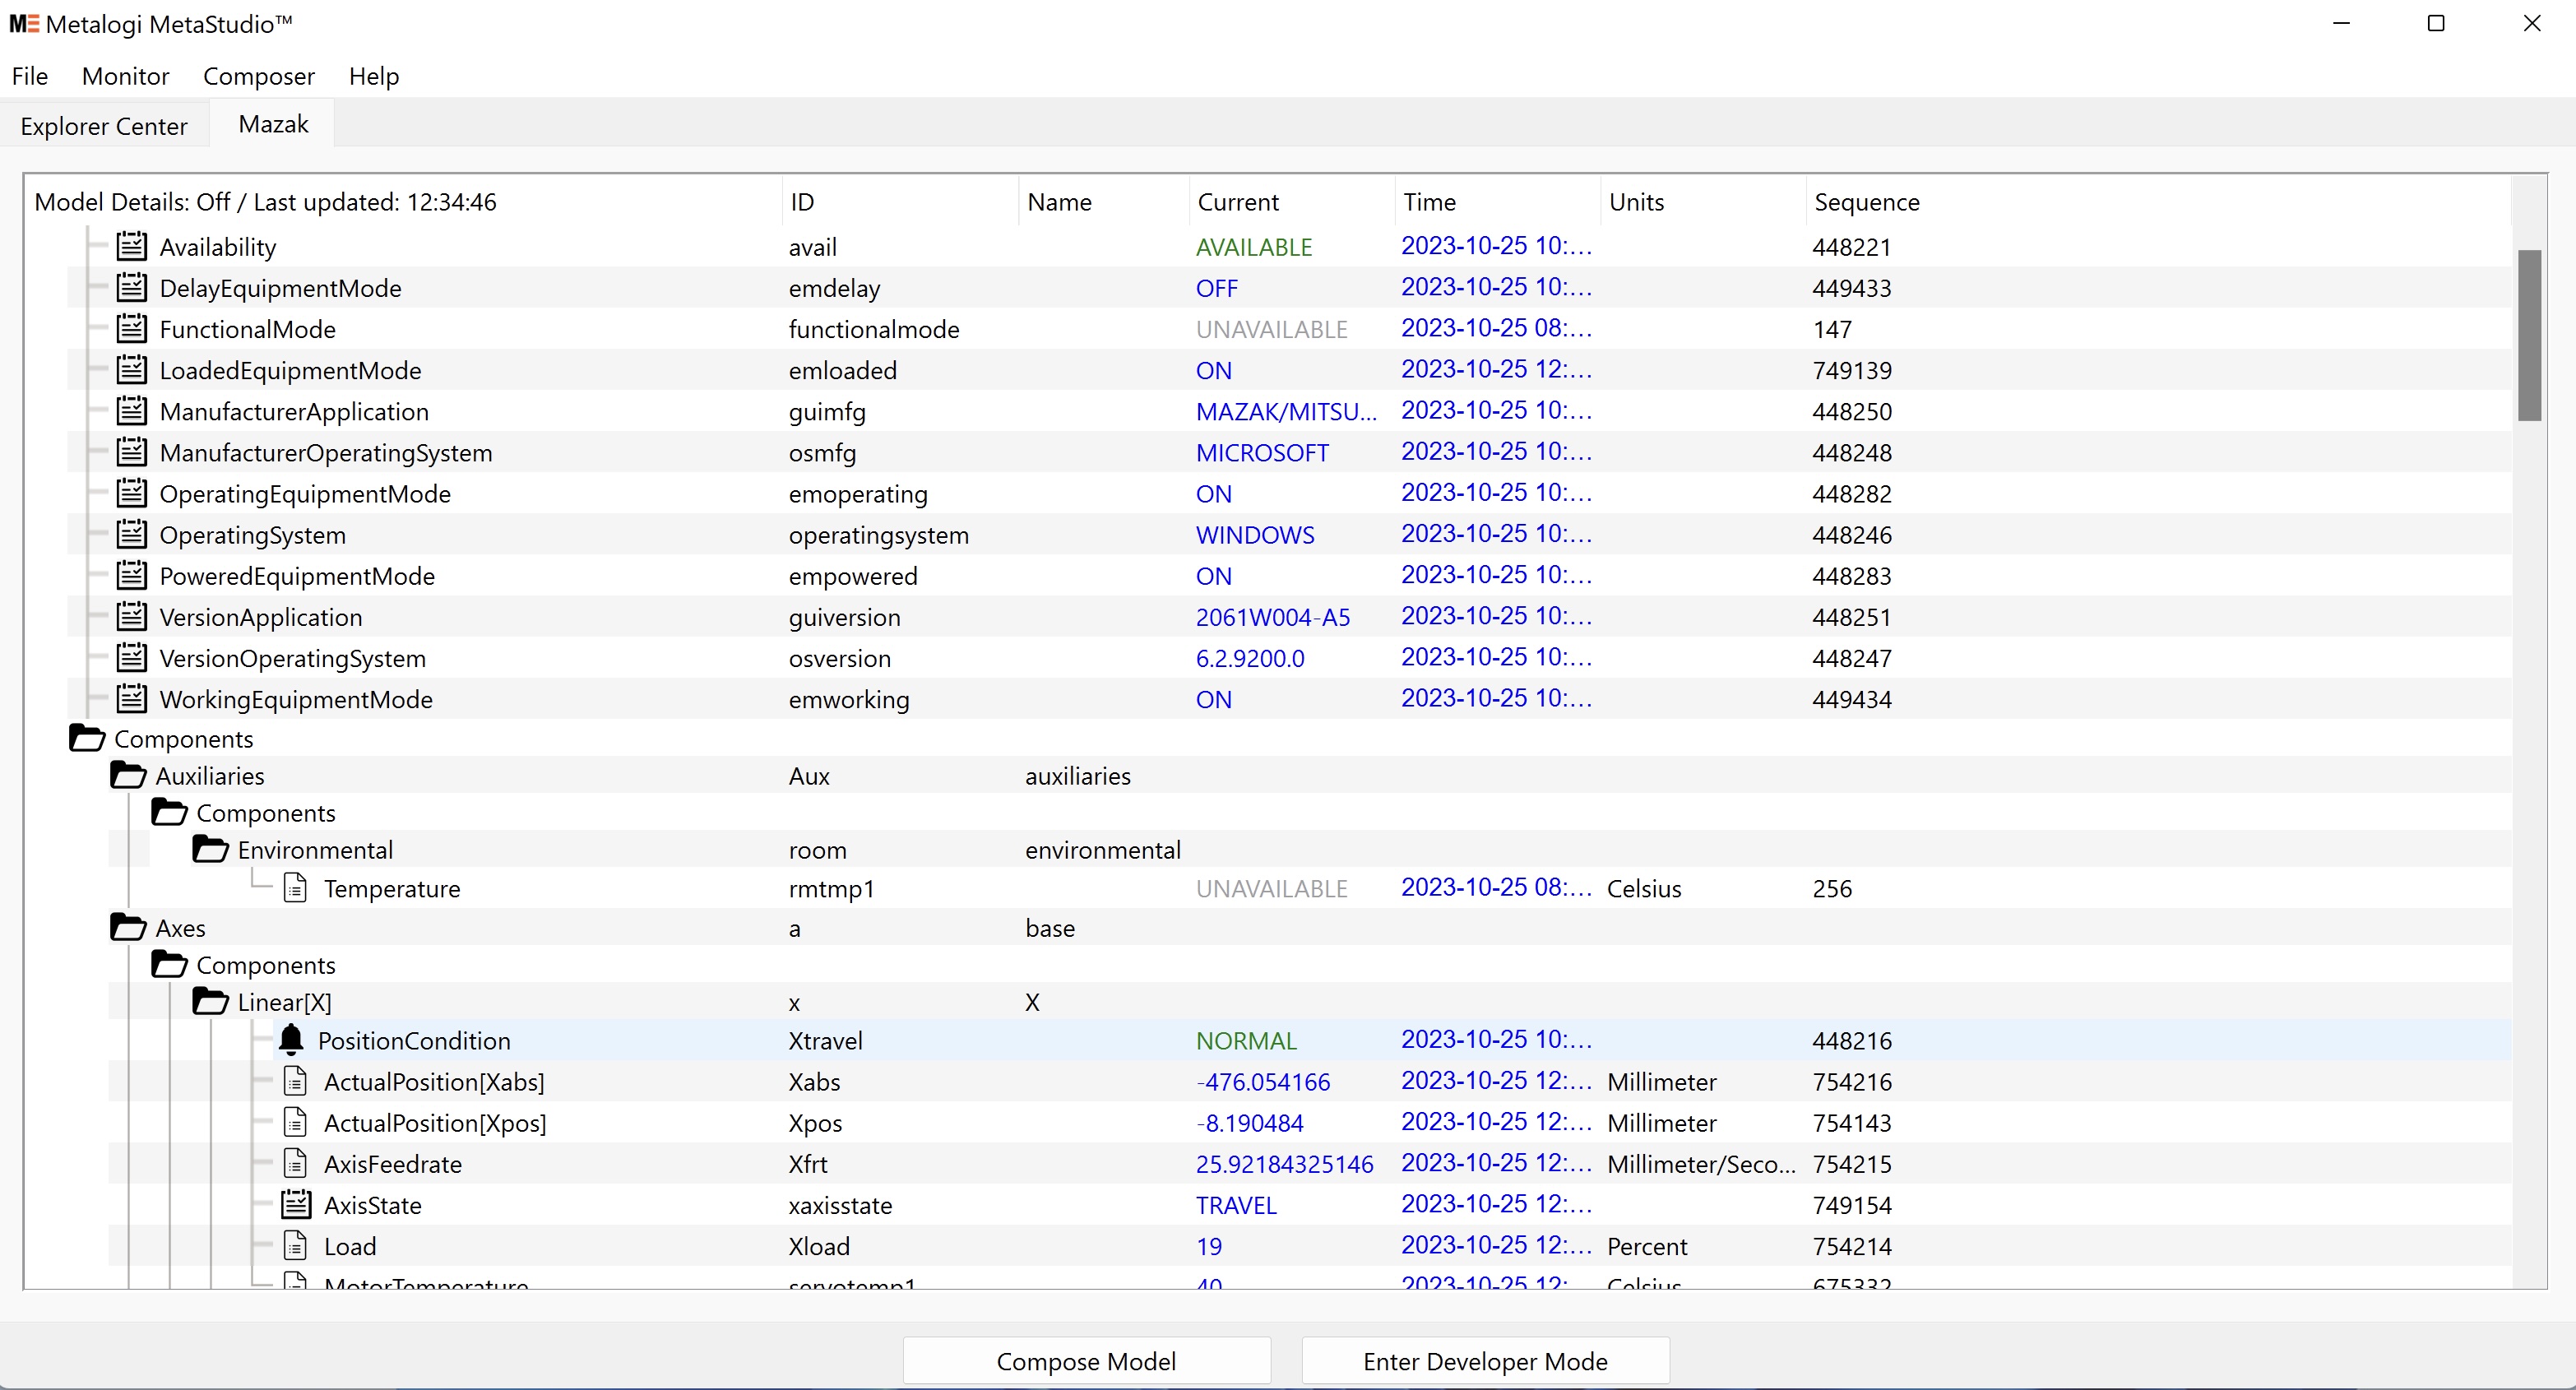
You can reorder the columns by drag and drop them or resize them. Additionally, you can hide/show them under Monitor > Show Column. The column configuration is memorized automatically and it will be applied until the next changes or reset to default using Monitor > Reset Display.
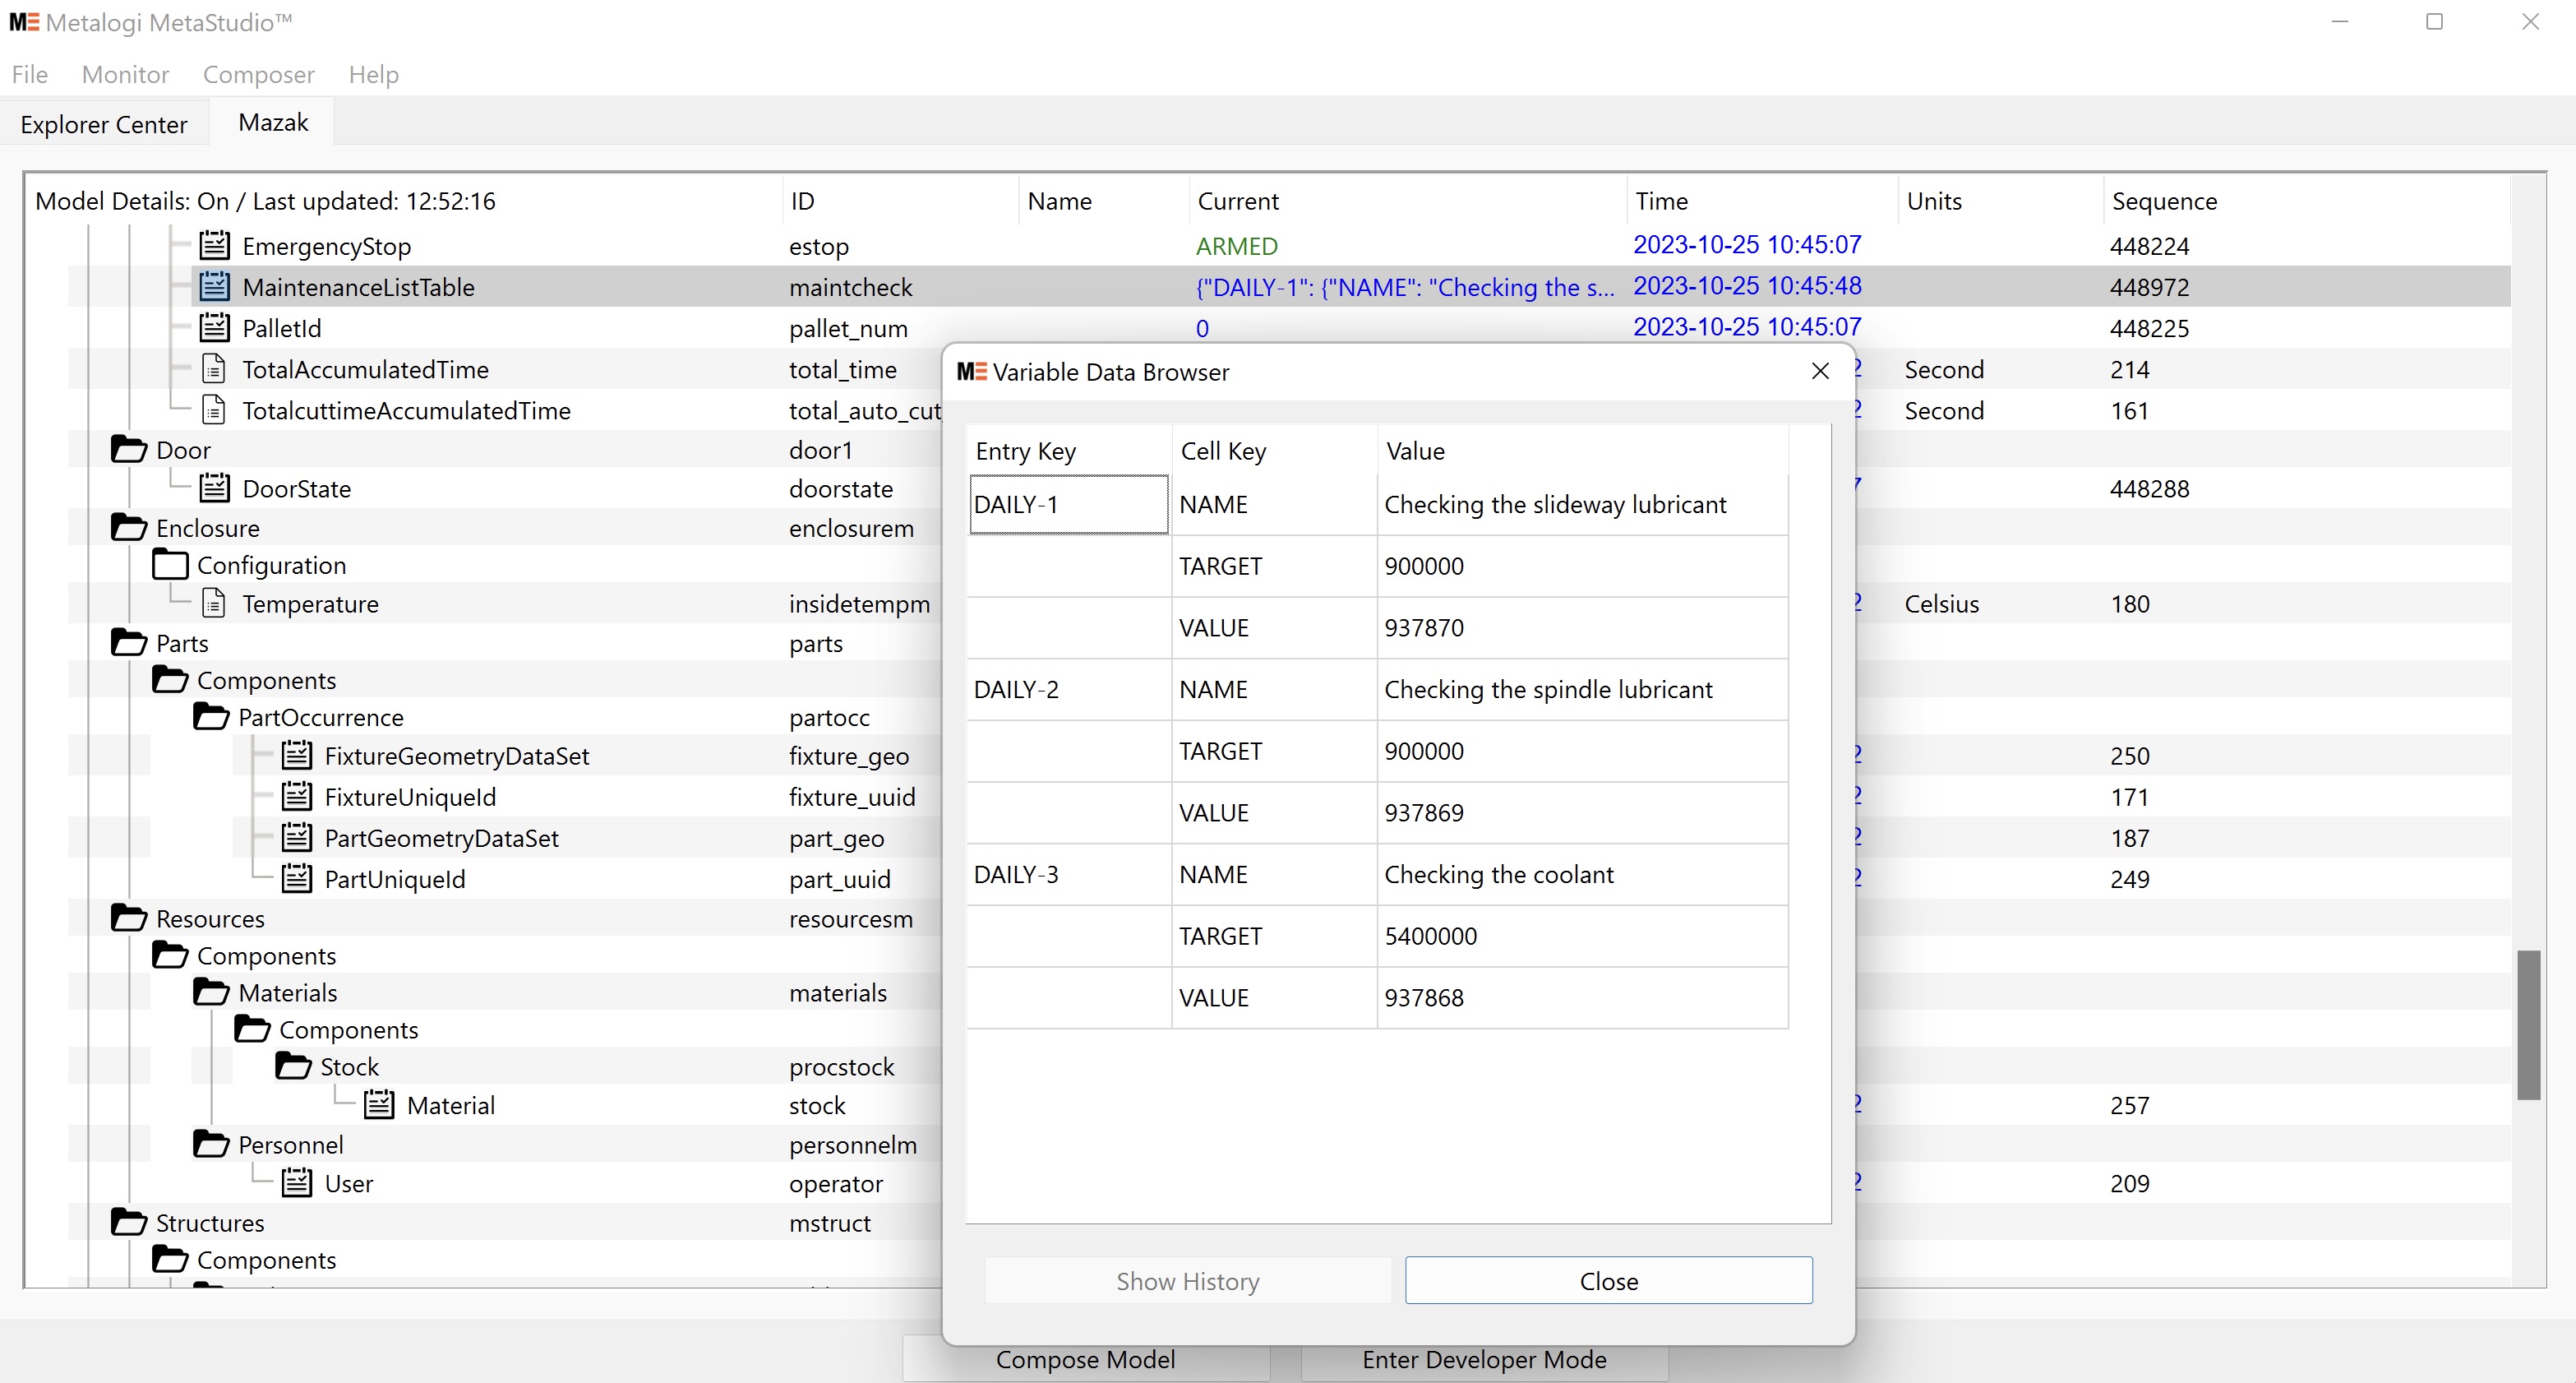
By default, the overview display only shows current value info for each data item. Additional configuration for each data item can be shown by toggling Composer > Show Model Details. In the example below, after turning on Model Details, it also displays the filter info for the data item Temperature.
¶ Drill Down Information
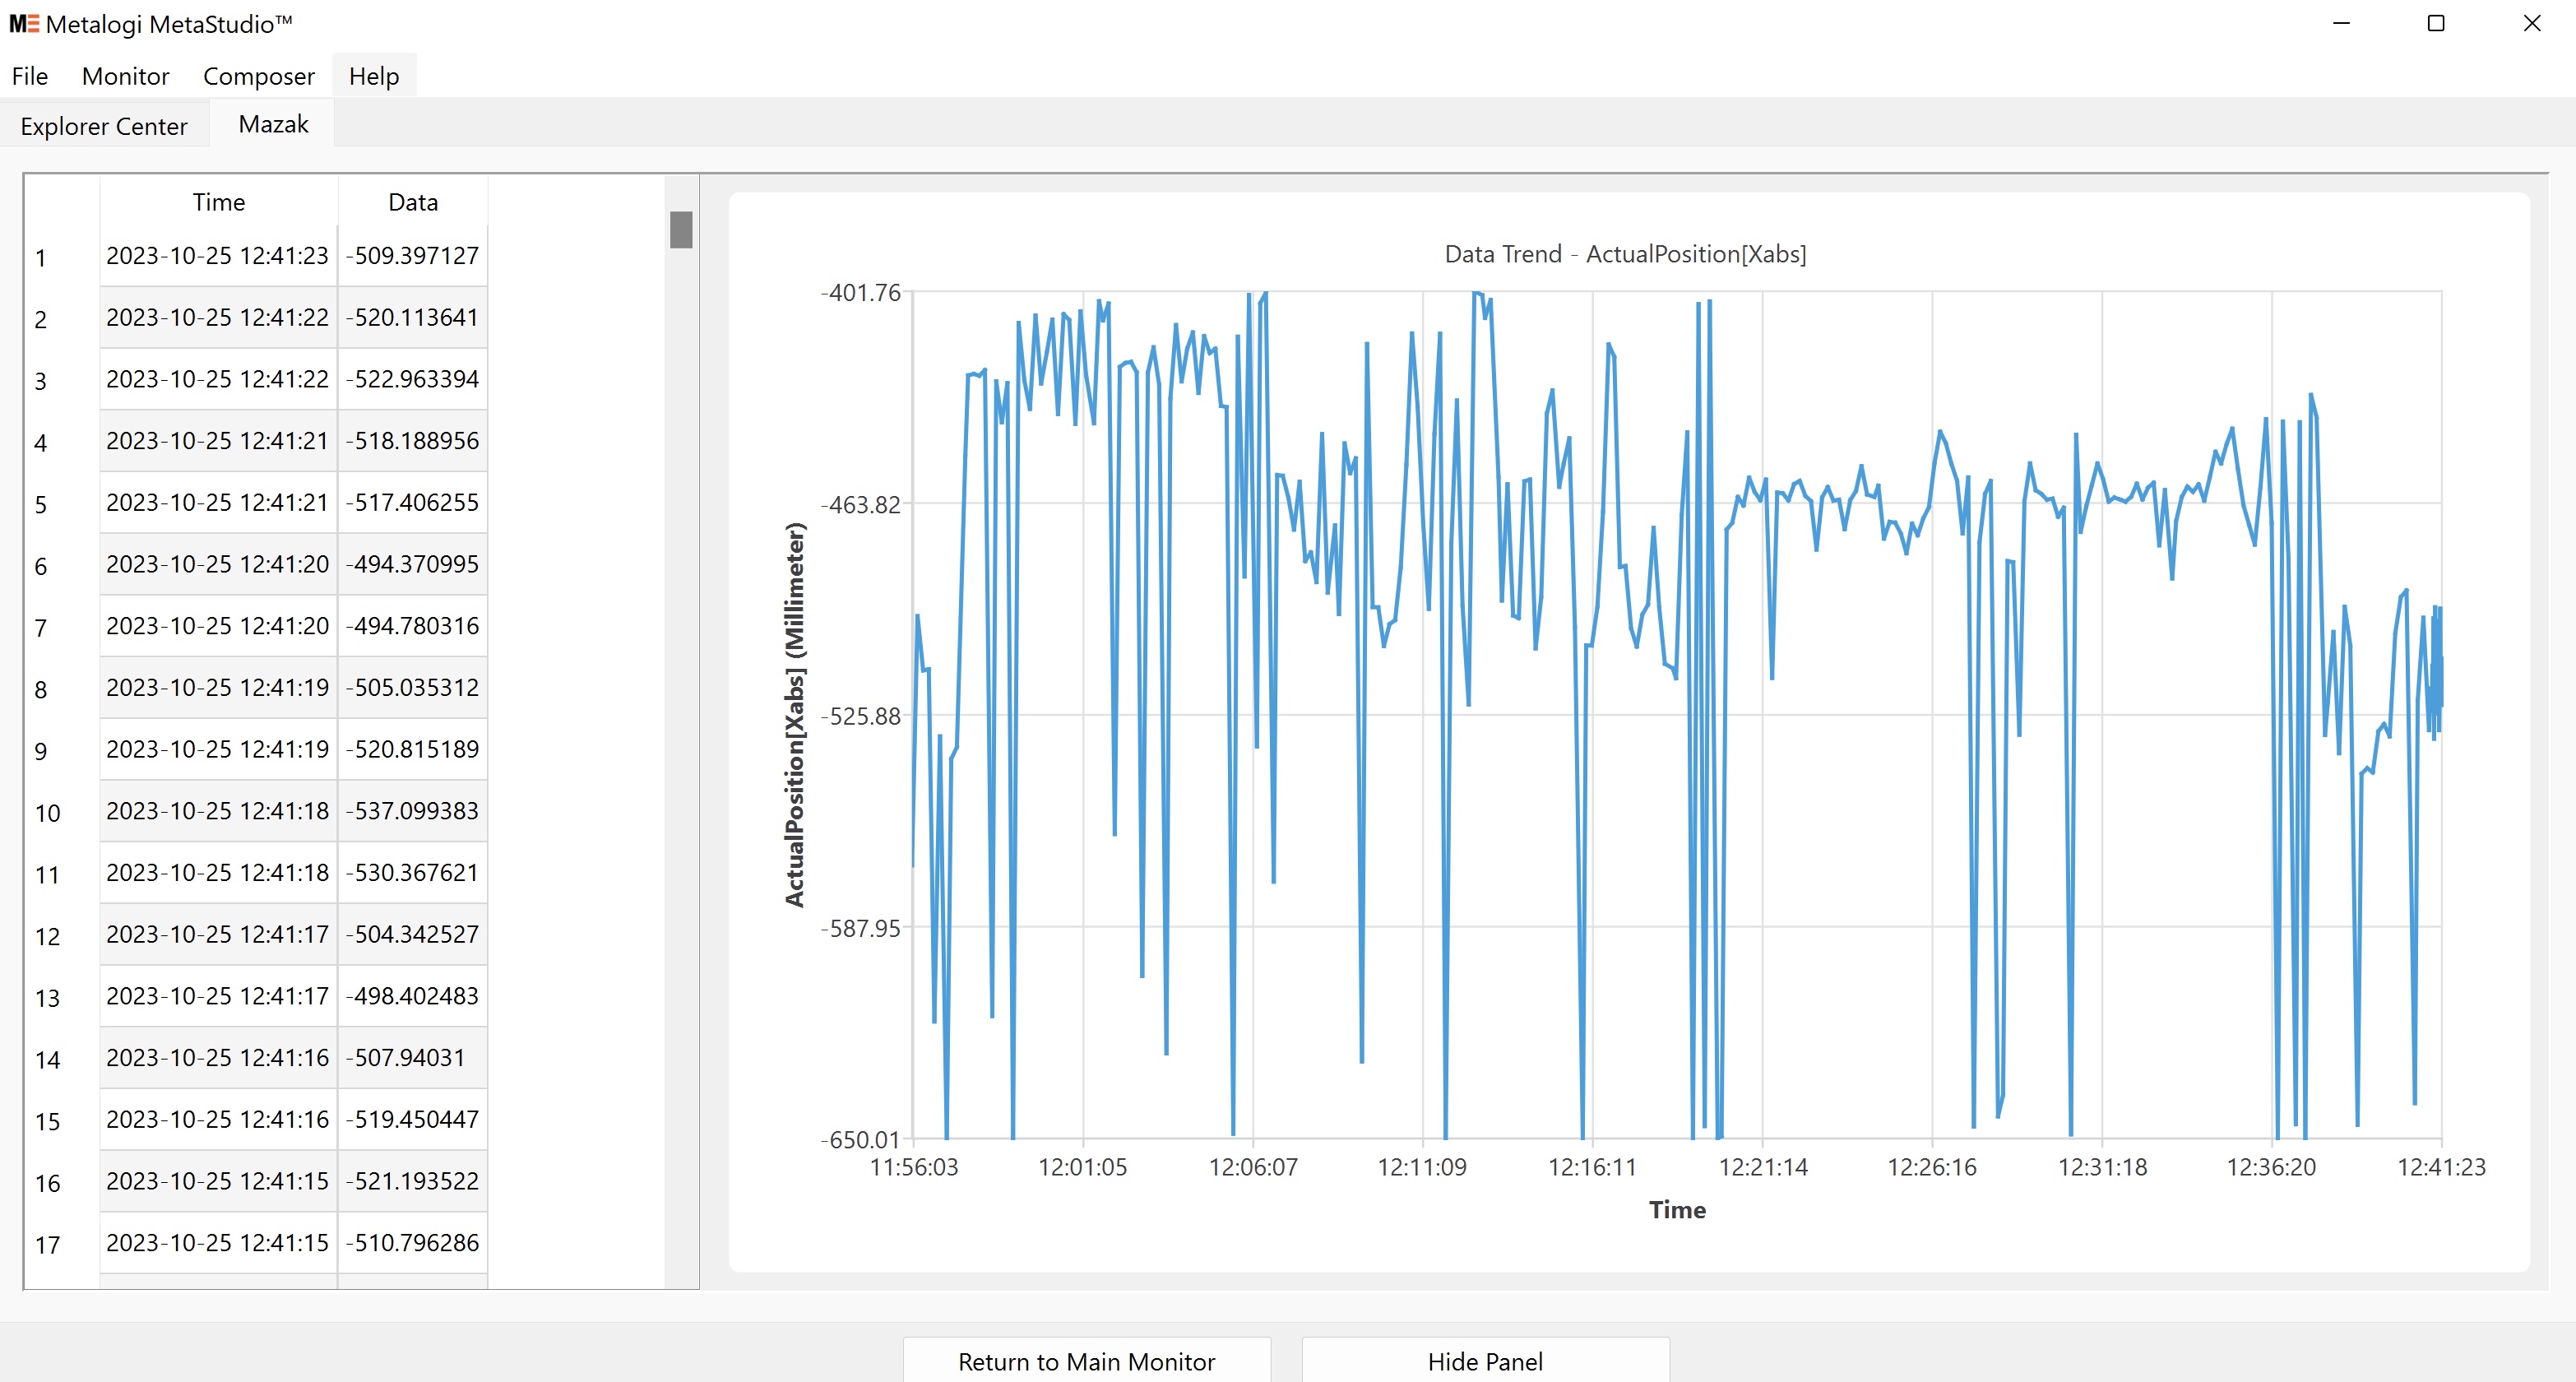
Double-clicking a data field brings up a graphic visualization of the history of that data field.
- Simple numeric data, such as the X position of a particular instrument, is displayed as a line graph over time:
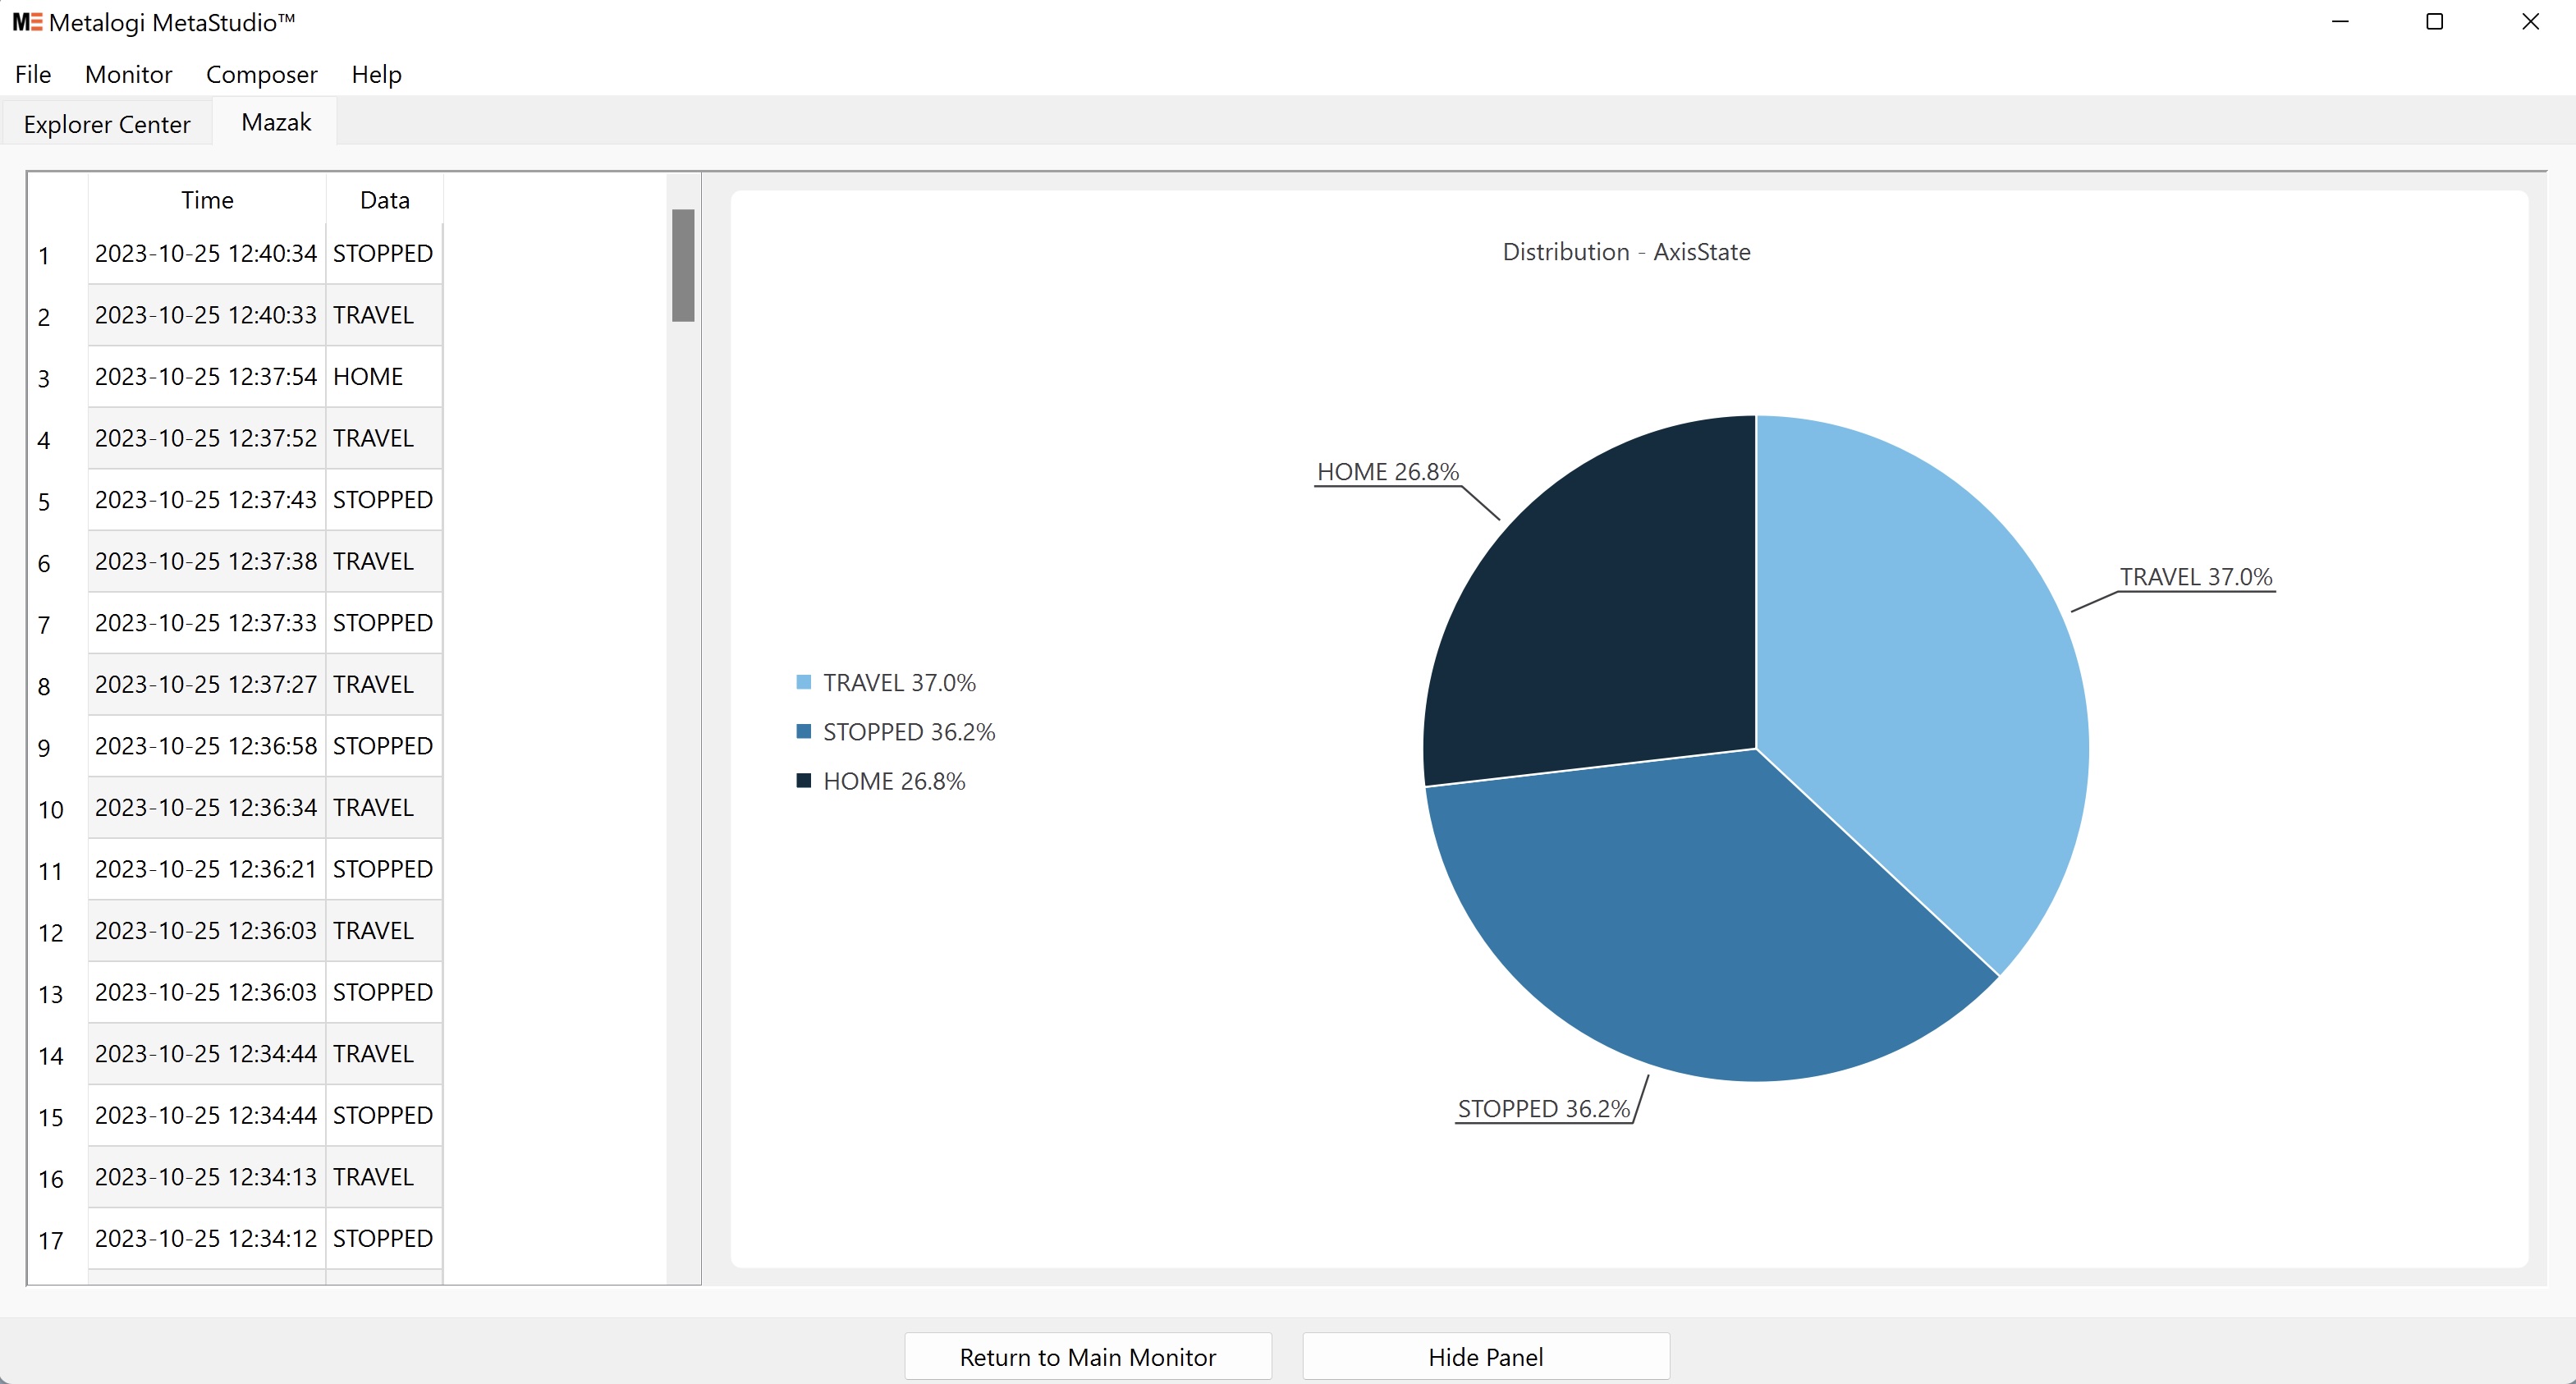
- Text data, such as availability or mode, is displayed as a pie chart that shows the proportion of time (not the proportion of data entries) spent in each status:
- 3D position data (data with the format of “X Y Z”) is represented as a 3D scatter plot:
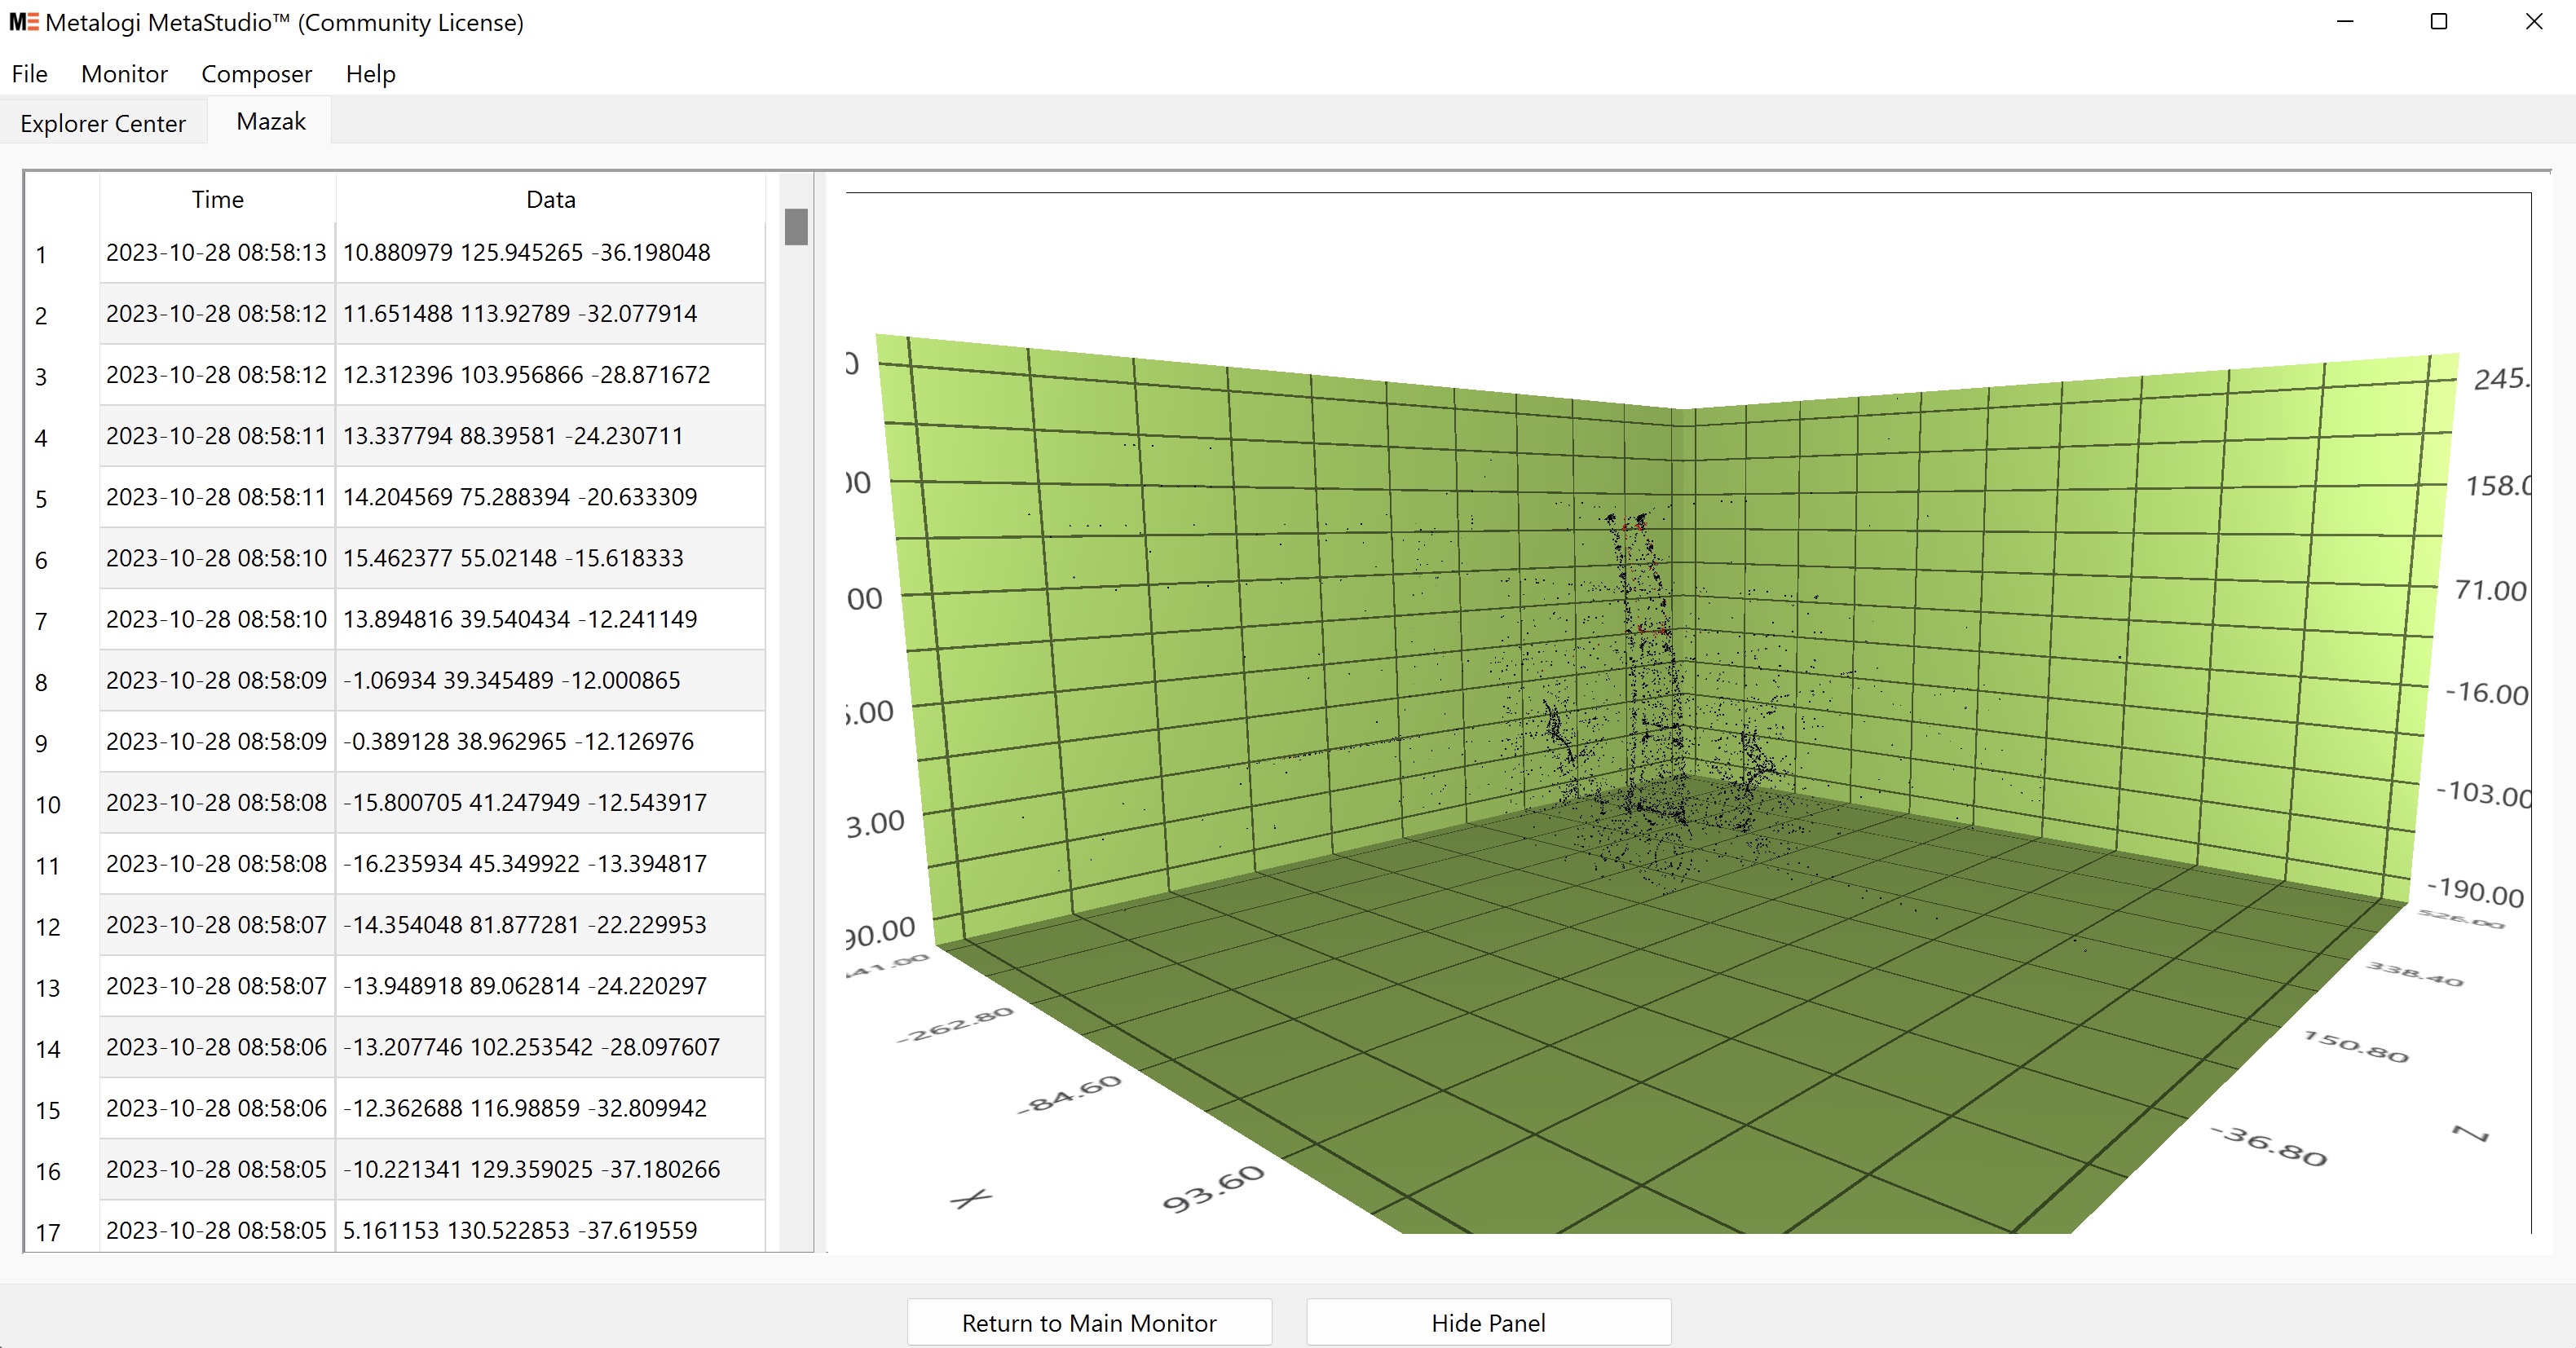
Any new data is displayed in red. You can click and drag with the right mouse button to change the viewing angle of the 3D plot.
- Data set - if a data item is a table or dataset, an additional selection dialog will pop up to specify which individual data in the data set to display.
¶ Developer Mode
By default, the Device Monitor Window composes the machine information returned by the MTConnect agent's data in a user-friendly hierarchical structure. To show the raw MTConnect data that is received from the machine, you can access the Developer Mode by selecting Monitor > Enter Developer Mode.
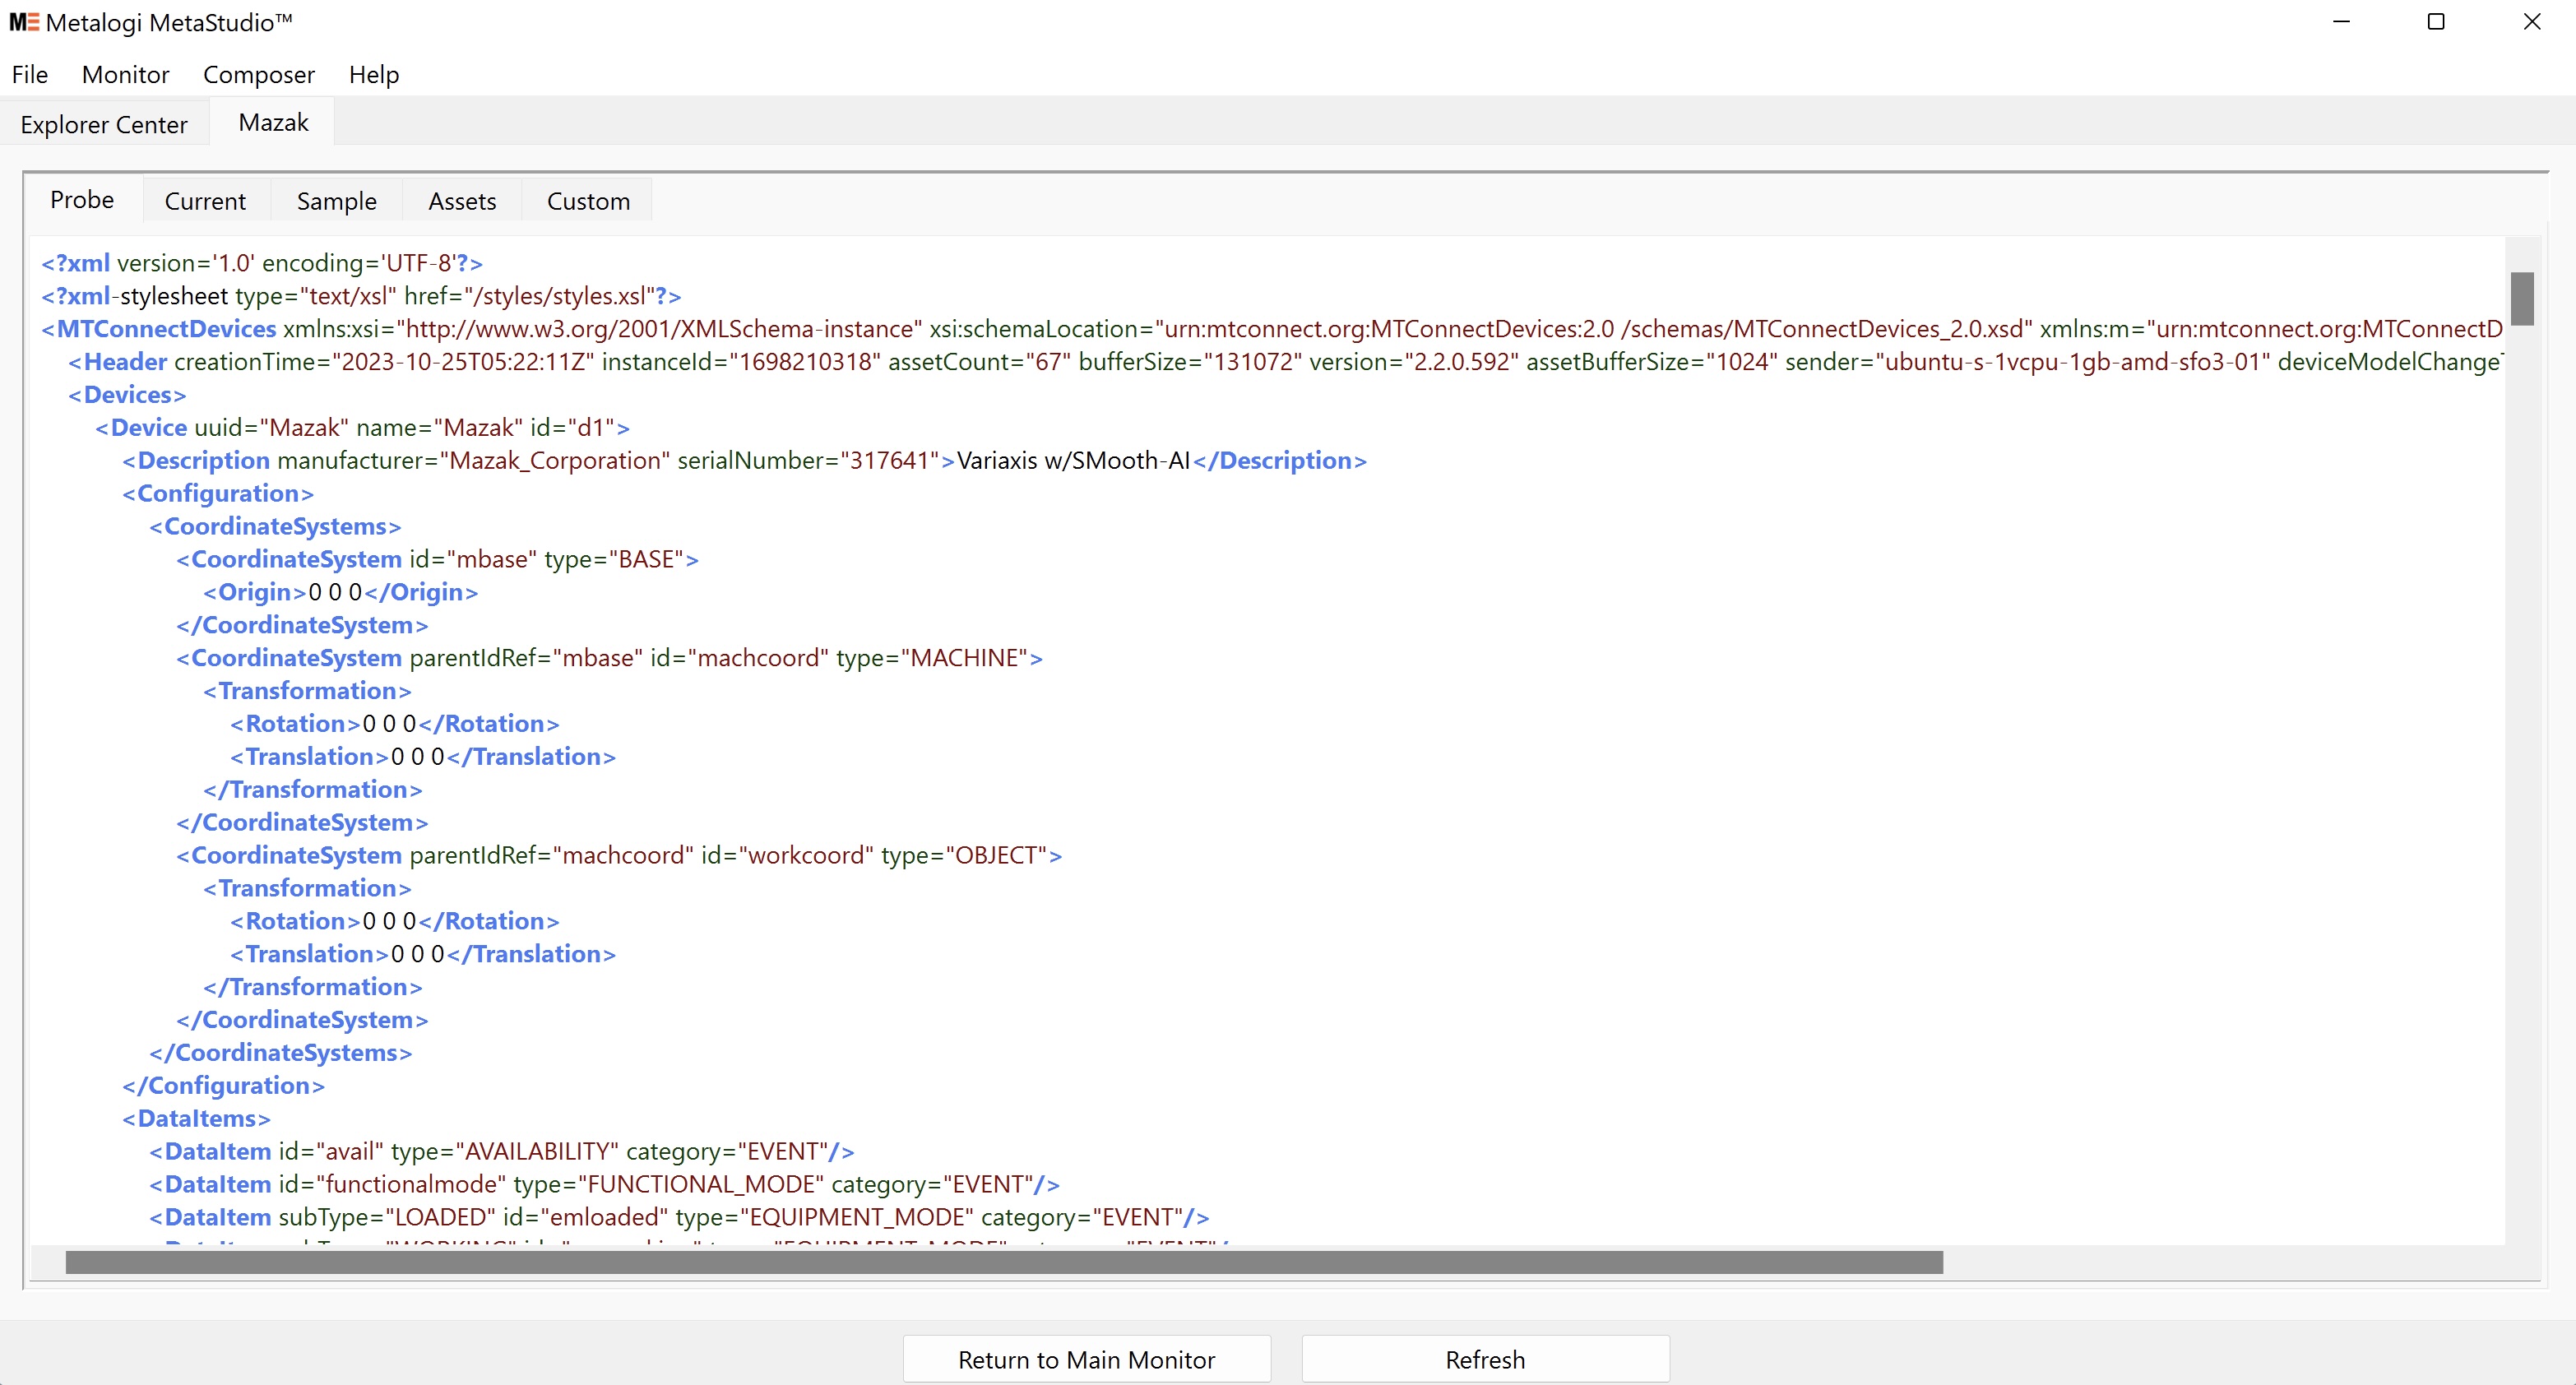
The data is displayed as a snapshot in time. To refresh the screen, press [Alt-U] or under Monitor > Refresh.
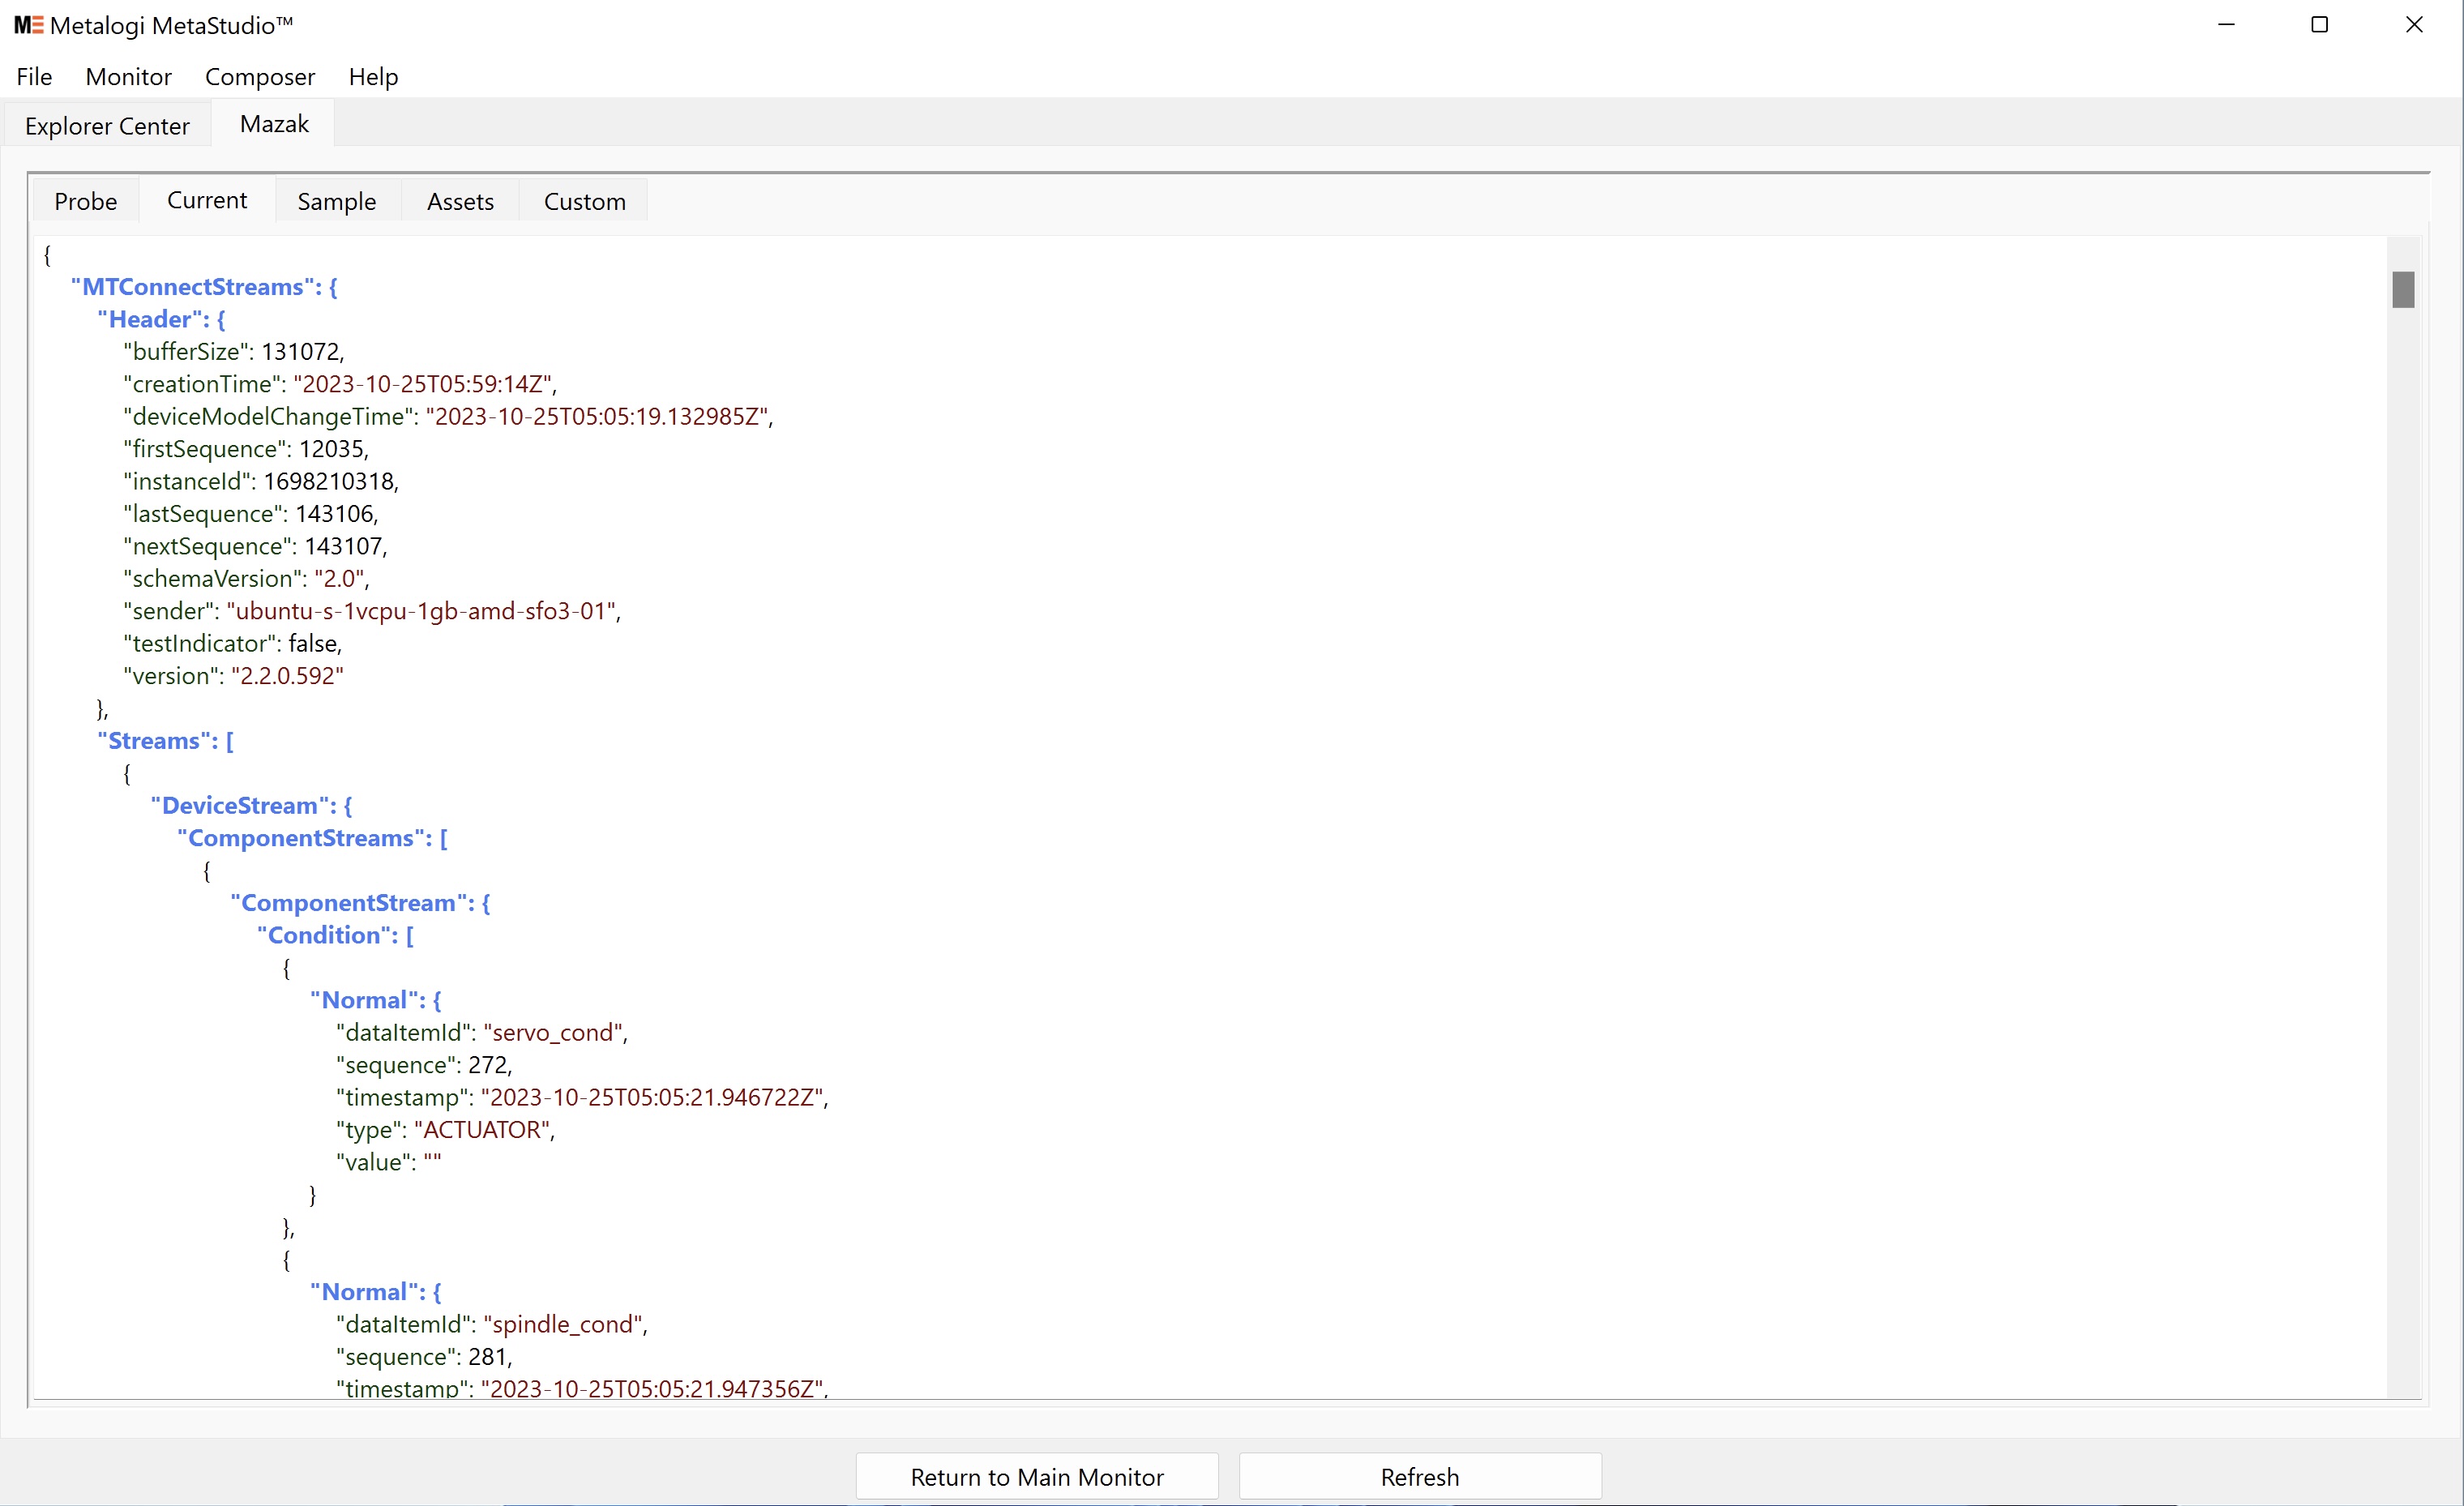
The display can also be switched to JSON (supported by MTConnect Agent v1.6 or later) under Monitor > Display Format > JSON.
- The Probe tab shows the MTConnect probe for the particular machine, which describes the data fields that are available and the specifications for each data field such as units, types, and categories.
- The Current tab shows the latest raw data received from the MTConnect agent.
- The Sample tab shows a raw history of data for each data field.
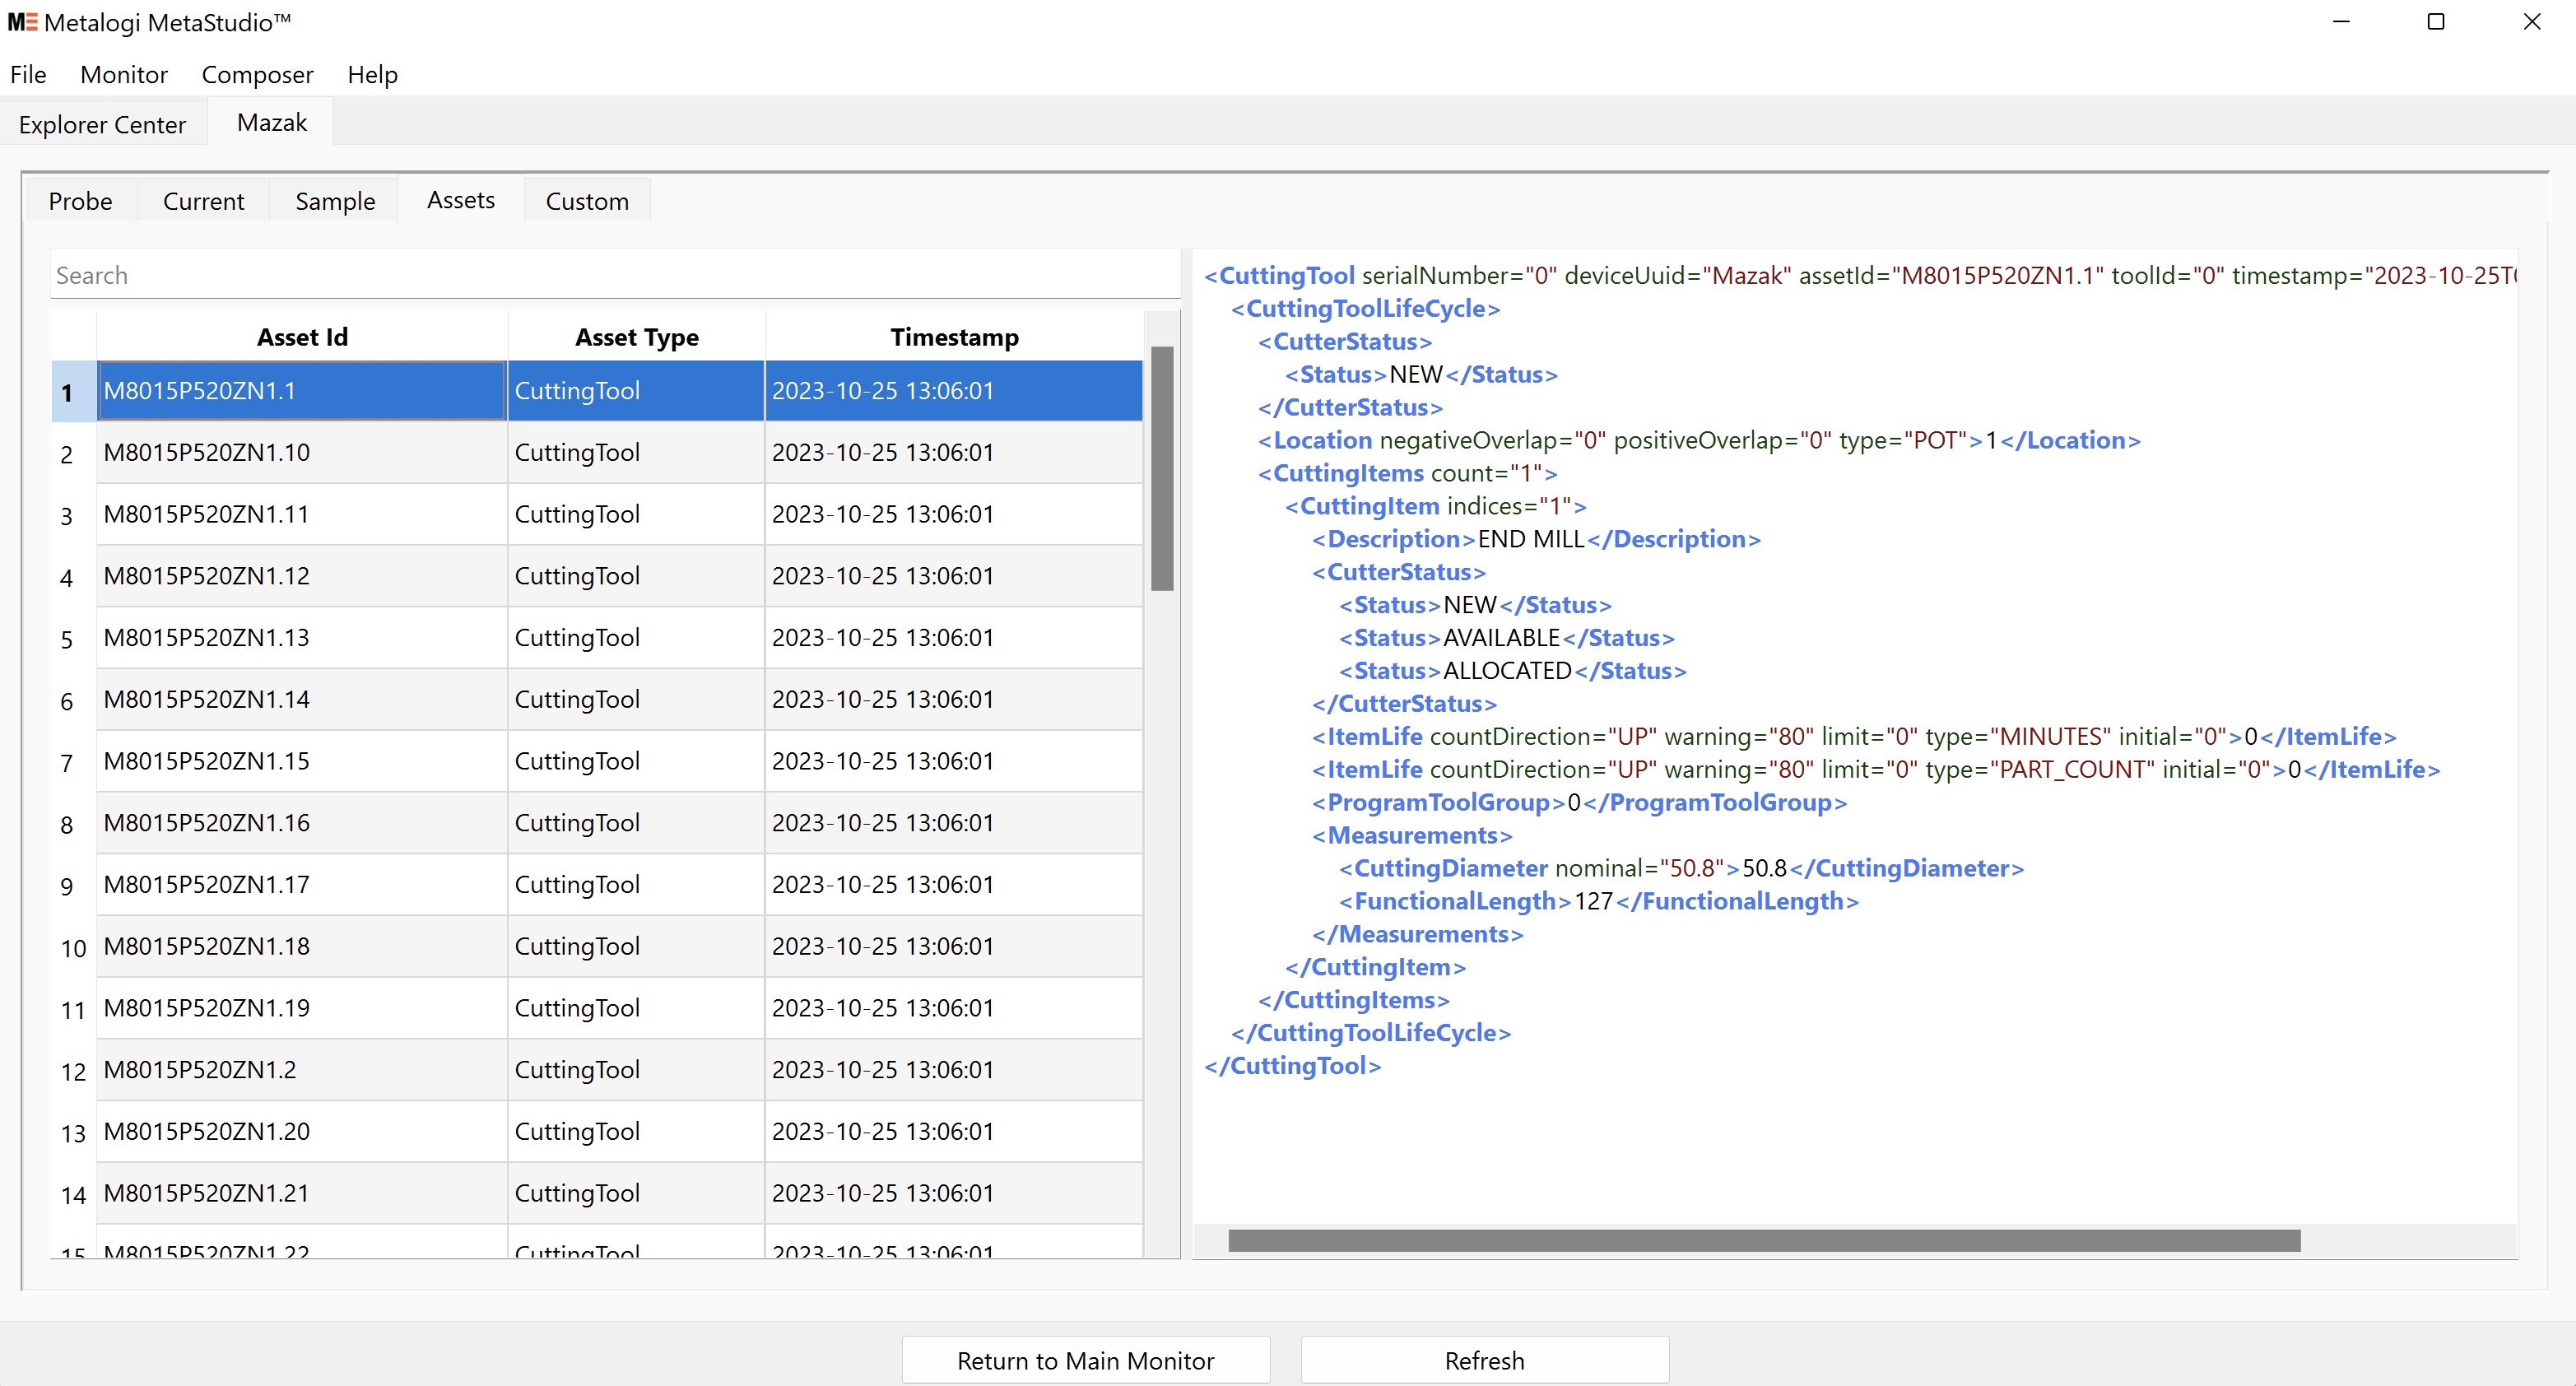
- The Assets tab shows the inventory of the assets associated with the MTConnect data and its details.
- The Custom tab is for advanced queries. You can search and look up any data items in the MTConnect data stream.
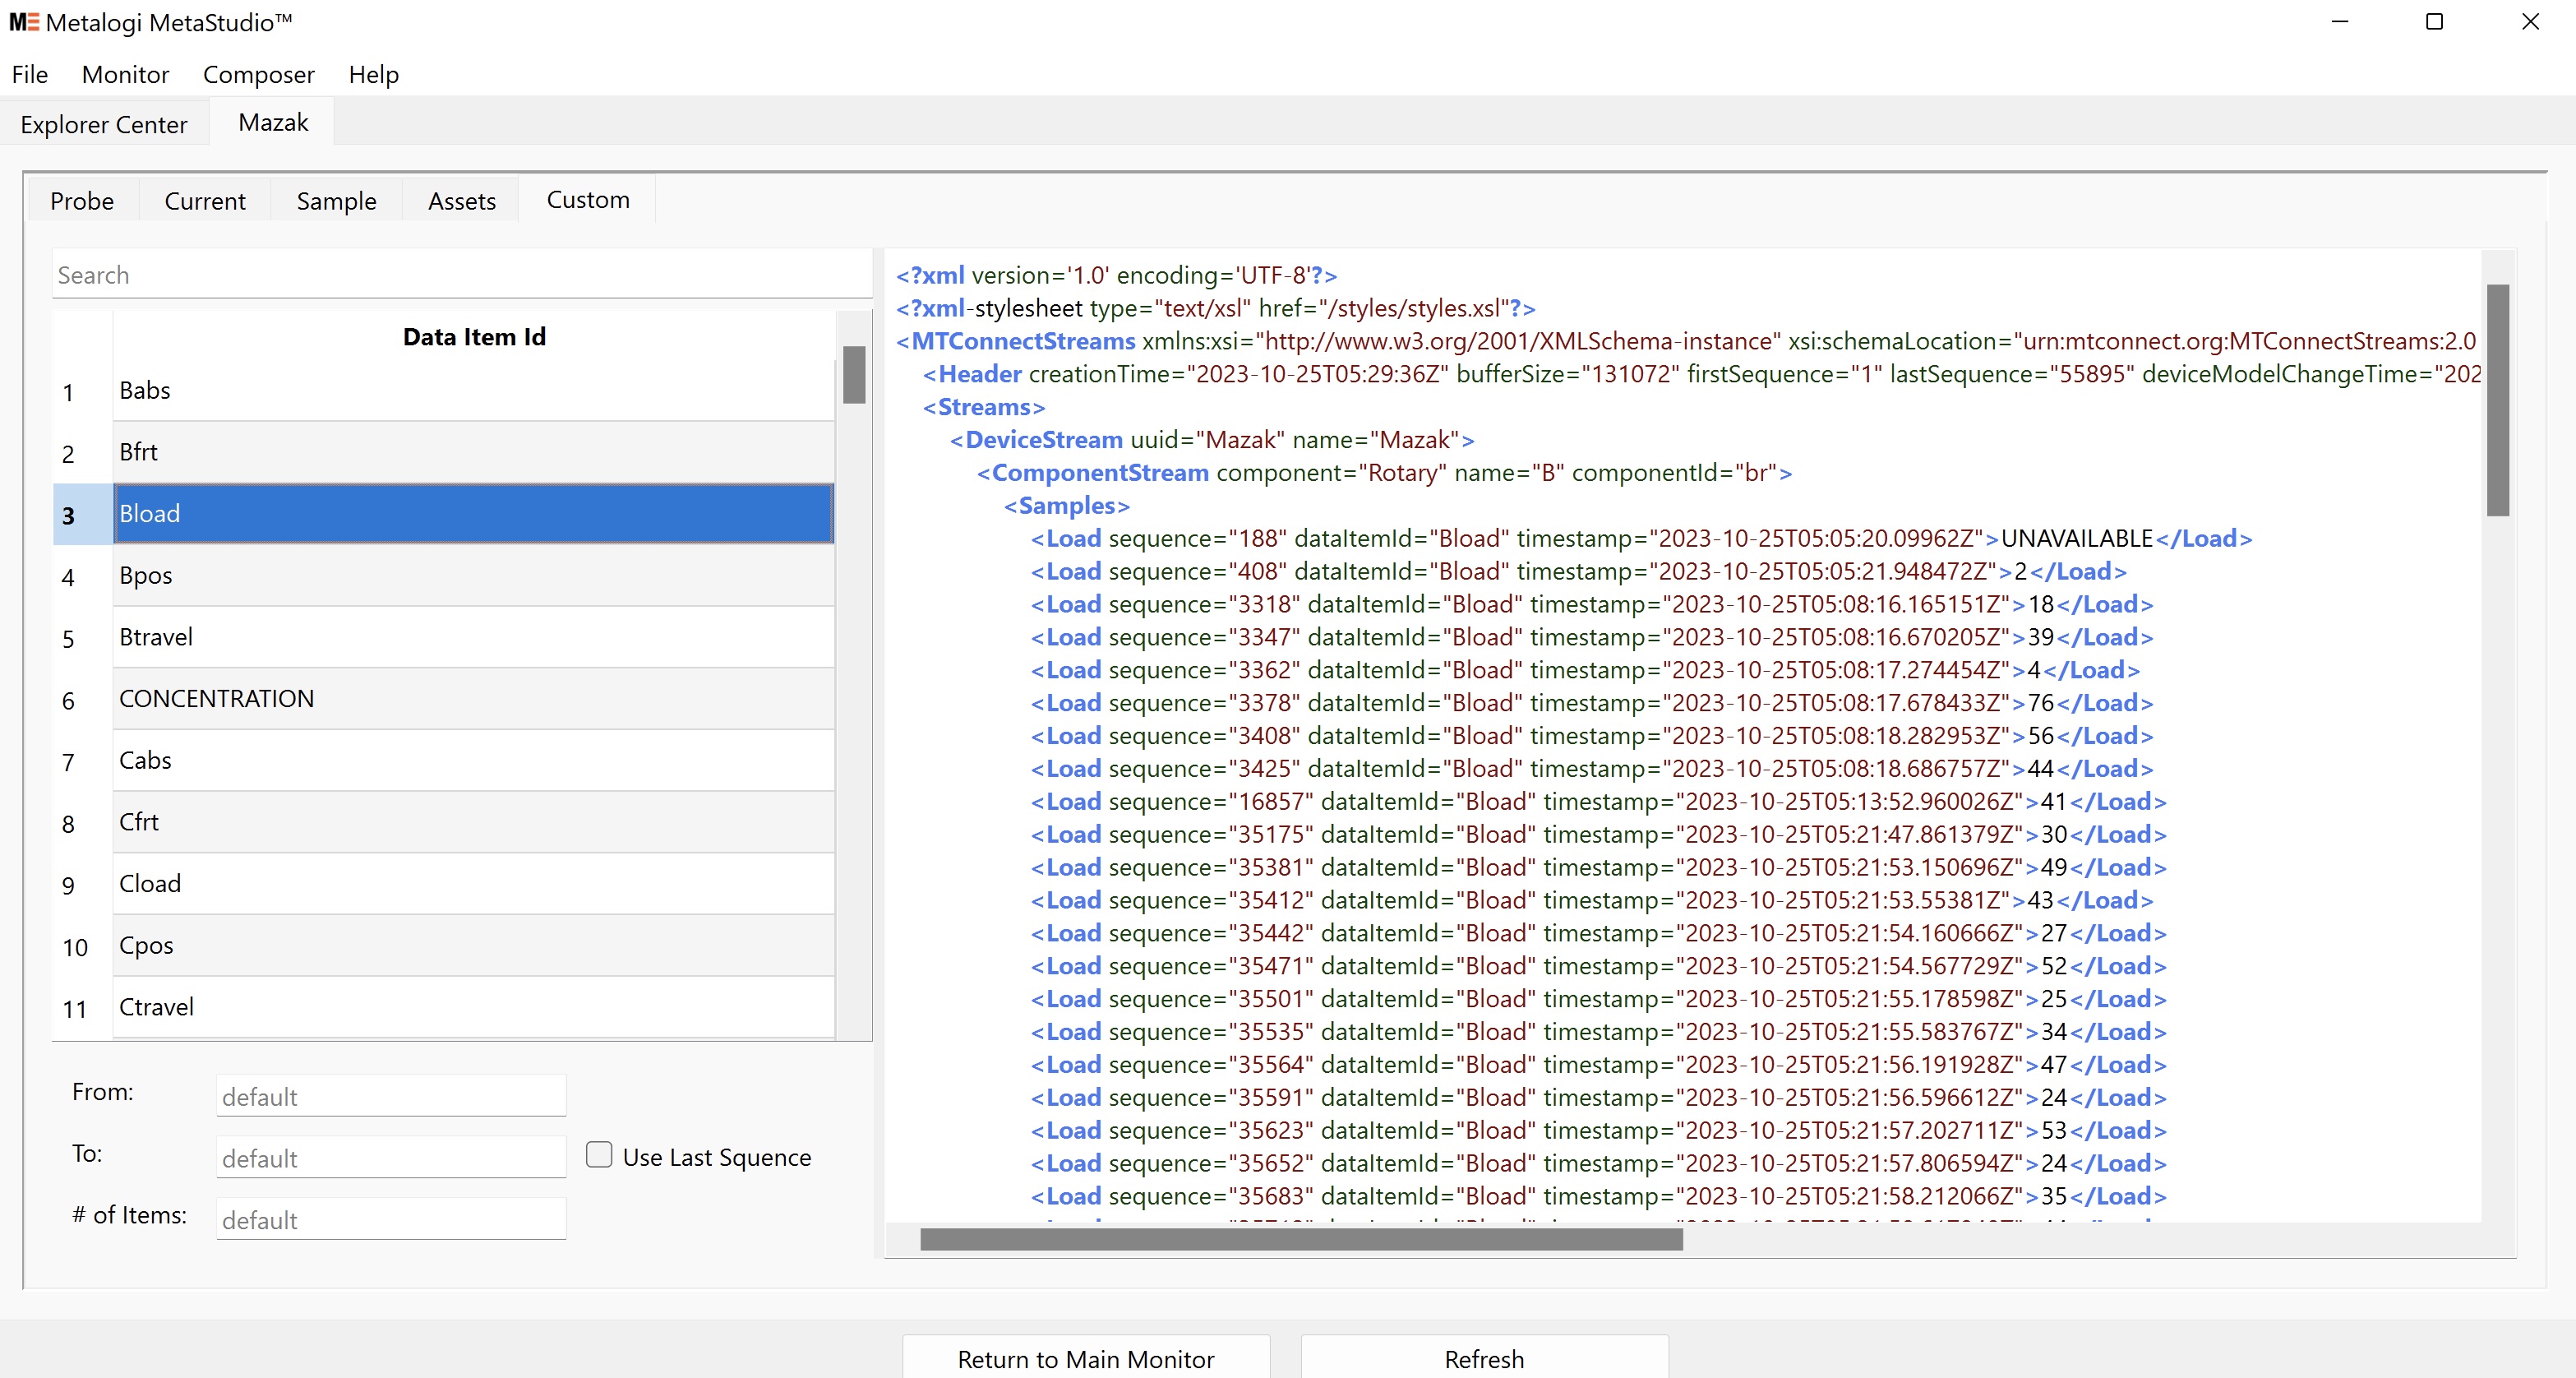
Double-click any data item ID to display its history. The history can be limited by From and To specification (sequence number), and # of items.
¶ Device Editor Window
You can access the Device Editor Window in a few ways:
- Compose a new device model by selecting File > New Model [Alt-N].
- Open a previously saved model by selecting File > Open Model [Alt-O].
- Capture and edit the current display device by Composer > Edit Agent's Model [Alt-K].
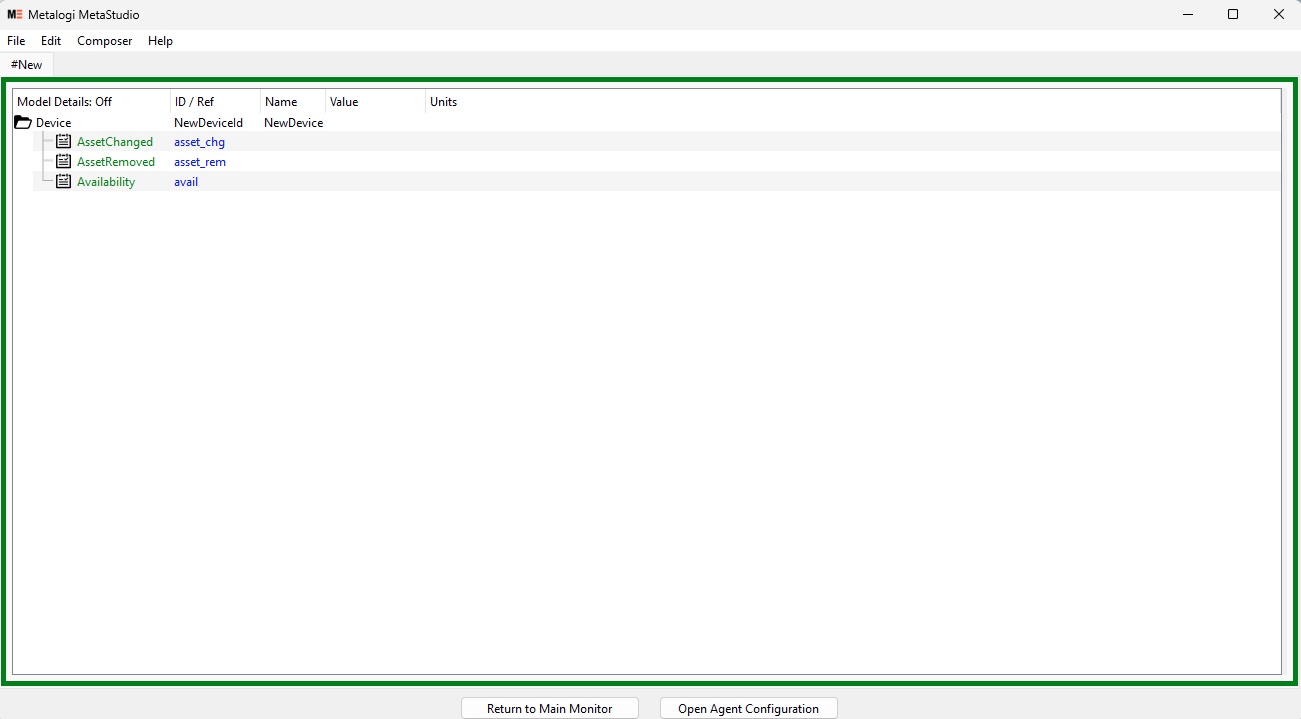
The device name on the tab will be prefixed with “#” in editor mode. Similar to monitor mode, you can show or hide the details of each data item by Composer > Show Model Details.
¶ Additional Video Info
To set up a new device model, you can use the instructions in this video as an example.
¶ New Model/Open Model/Save Model/Import Model
You can start a new configuration by File > New Model. A new model with minimum configuration will be shown.
At any time, you can save the model data to a file by selecting File > Save Model [Alt-S]. The file format can be either XML or JSON.
To reopen any existing model files, simply select File > Open Model [Alt-O]. You can choose from XML or JSON files.
You can also merge a device’s model info from another model file by selecting File > Import Model [Alt-I]. Note that the import file should only contain one device model. If you are editing multiple devices, select an item in the device you want to import to first.
¶ Adding a Top-Level Component
The next step for creating a new device model is to add top-level components. The top-level components have some constraints as defined in the MTConnect specification. To work along with these requirements, you can add a new top-level component by Edit > Add [Ctrl-A].
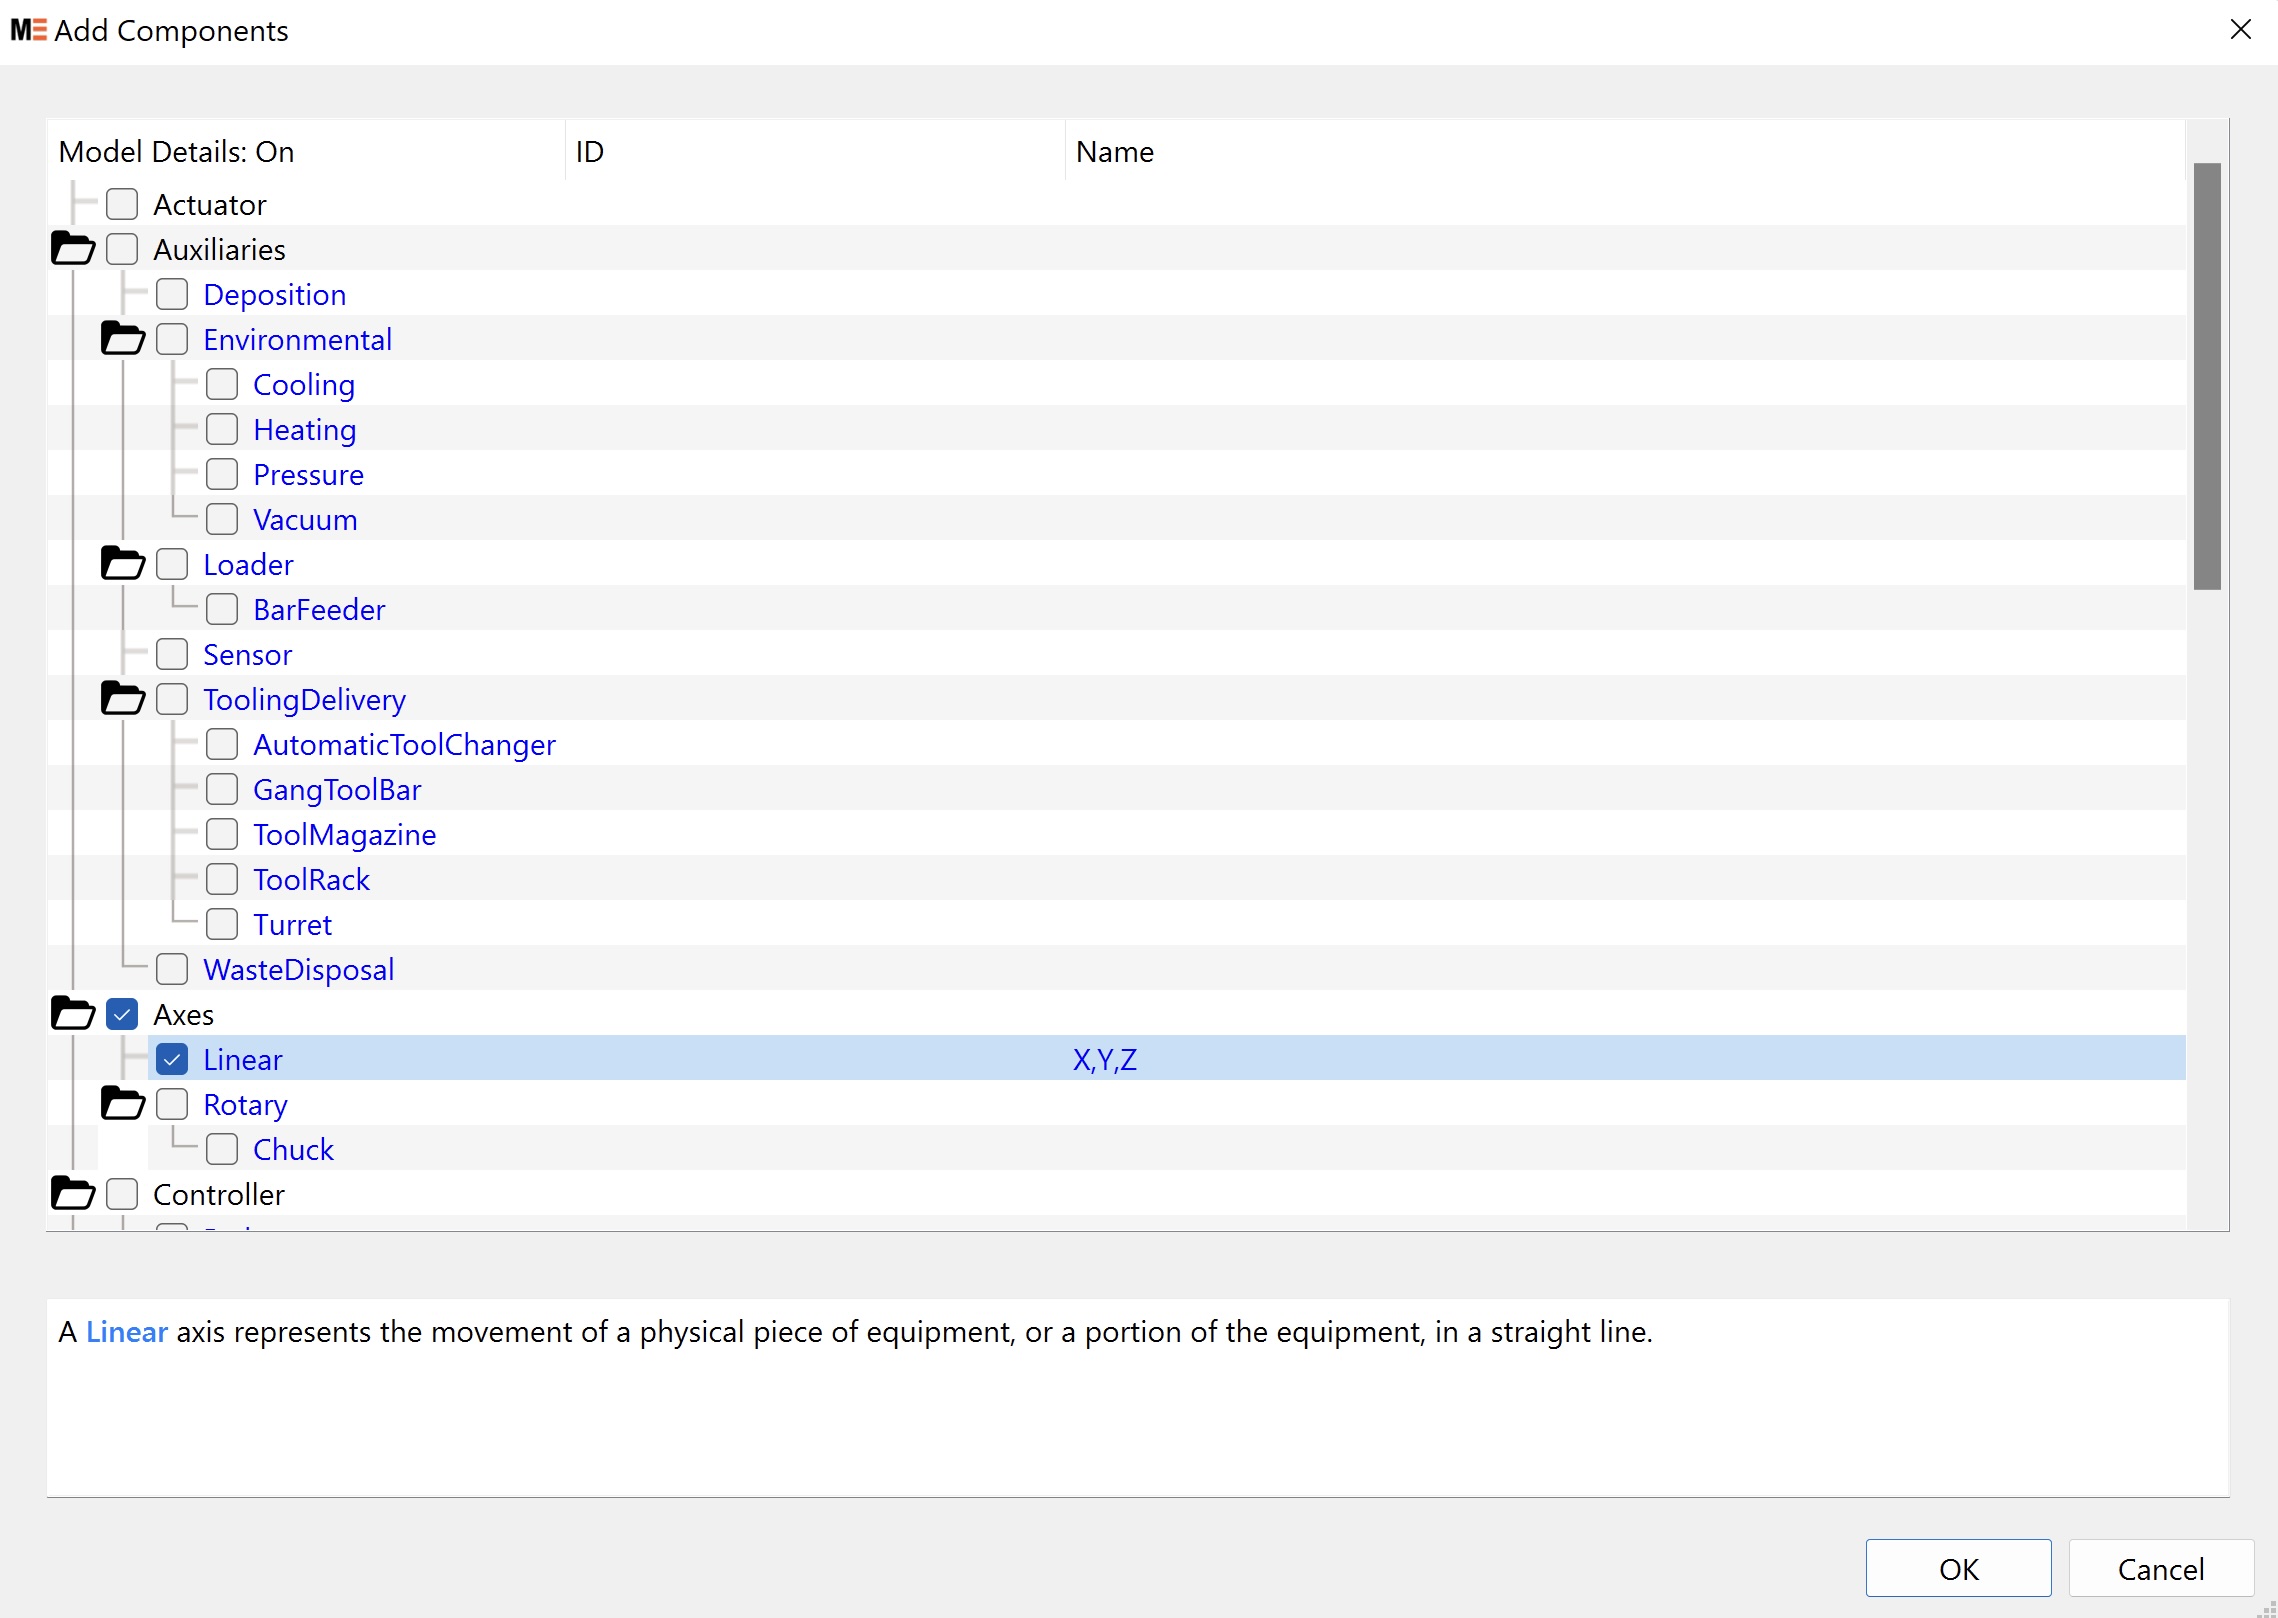
Check the boxes for the components you want to add. Enter the ID or Name of the component. If ID is not specified, one will be autogenerated for you.
The info box at the bottom will provide the definitions to guide your selection.
If you have more than one device in your configuration, select an item in the device that you want to add this top-level component to first.
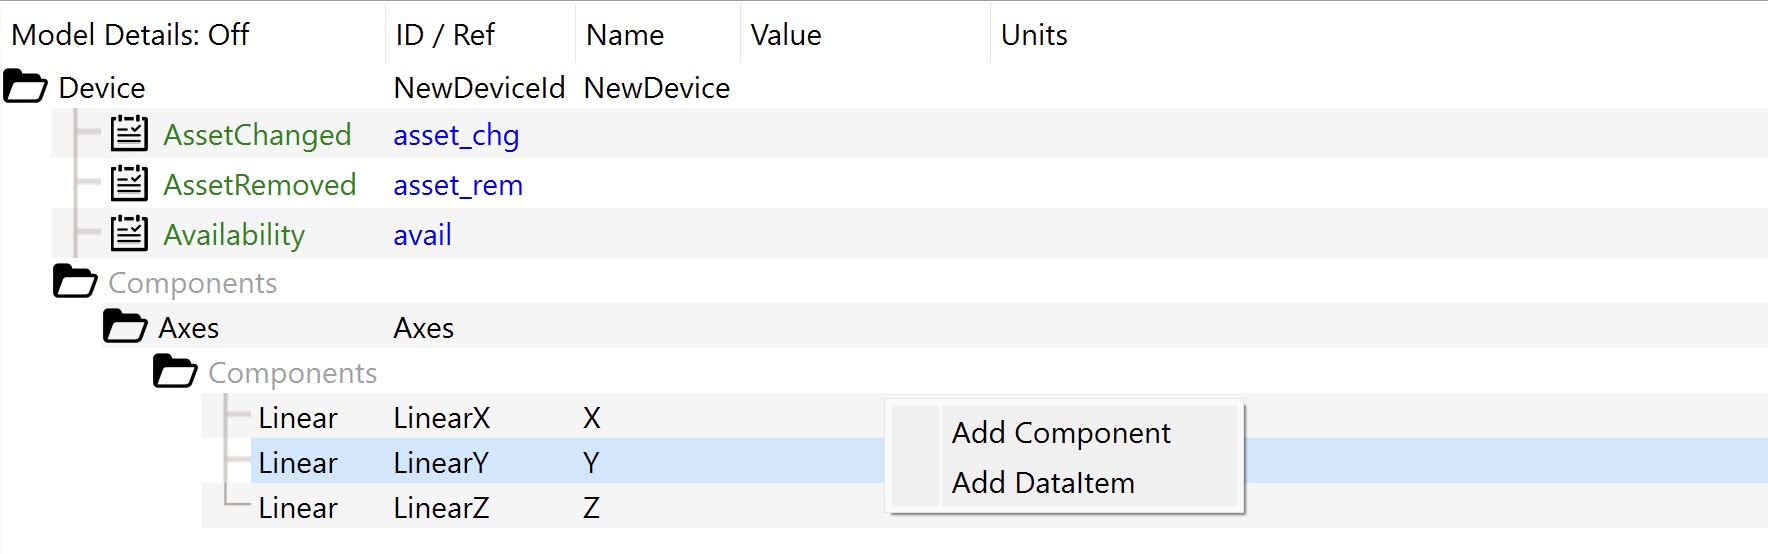
¶ Adding a Data Item or Component
Starting from the top-level components, you can then add a sub-component or data item. You can right-click a component and add a new child data item or component. It will prompt you for the selection. Note that top-level components can only be added by Edit > Add [Ctrl-A].
¶ Adding/Editing a Component Item
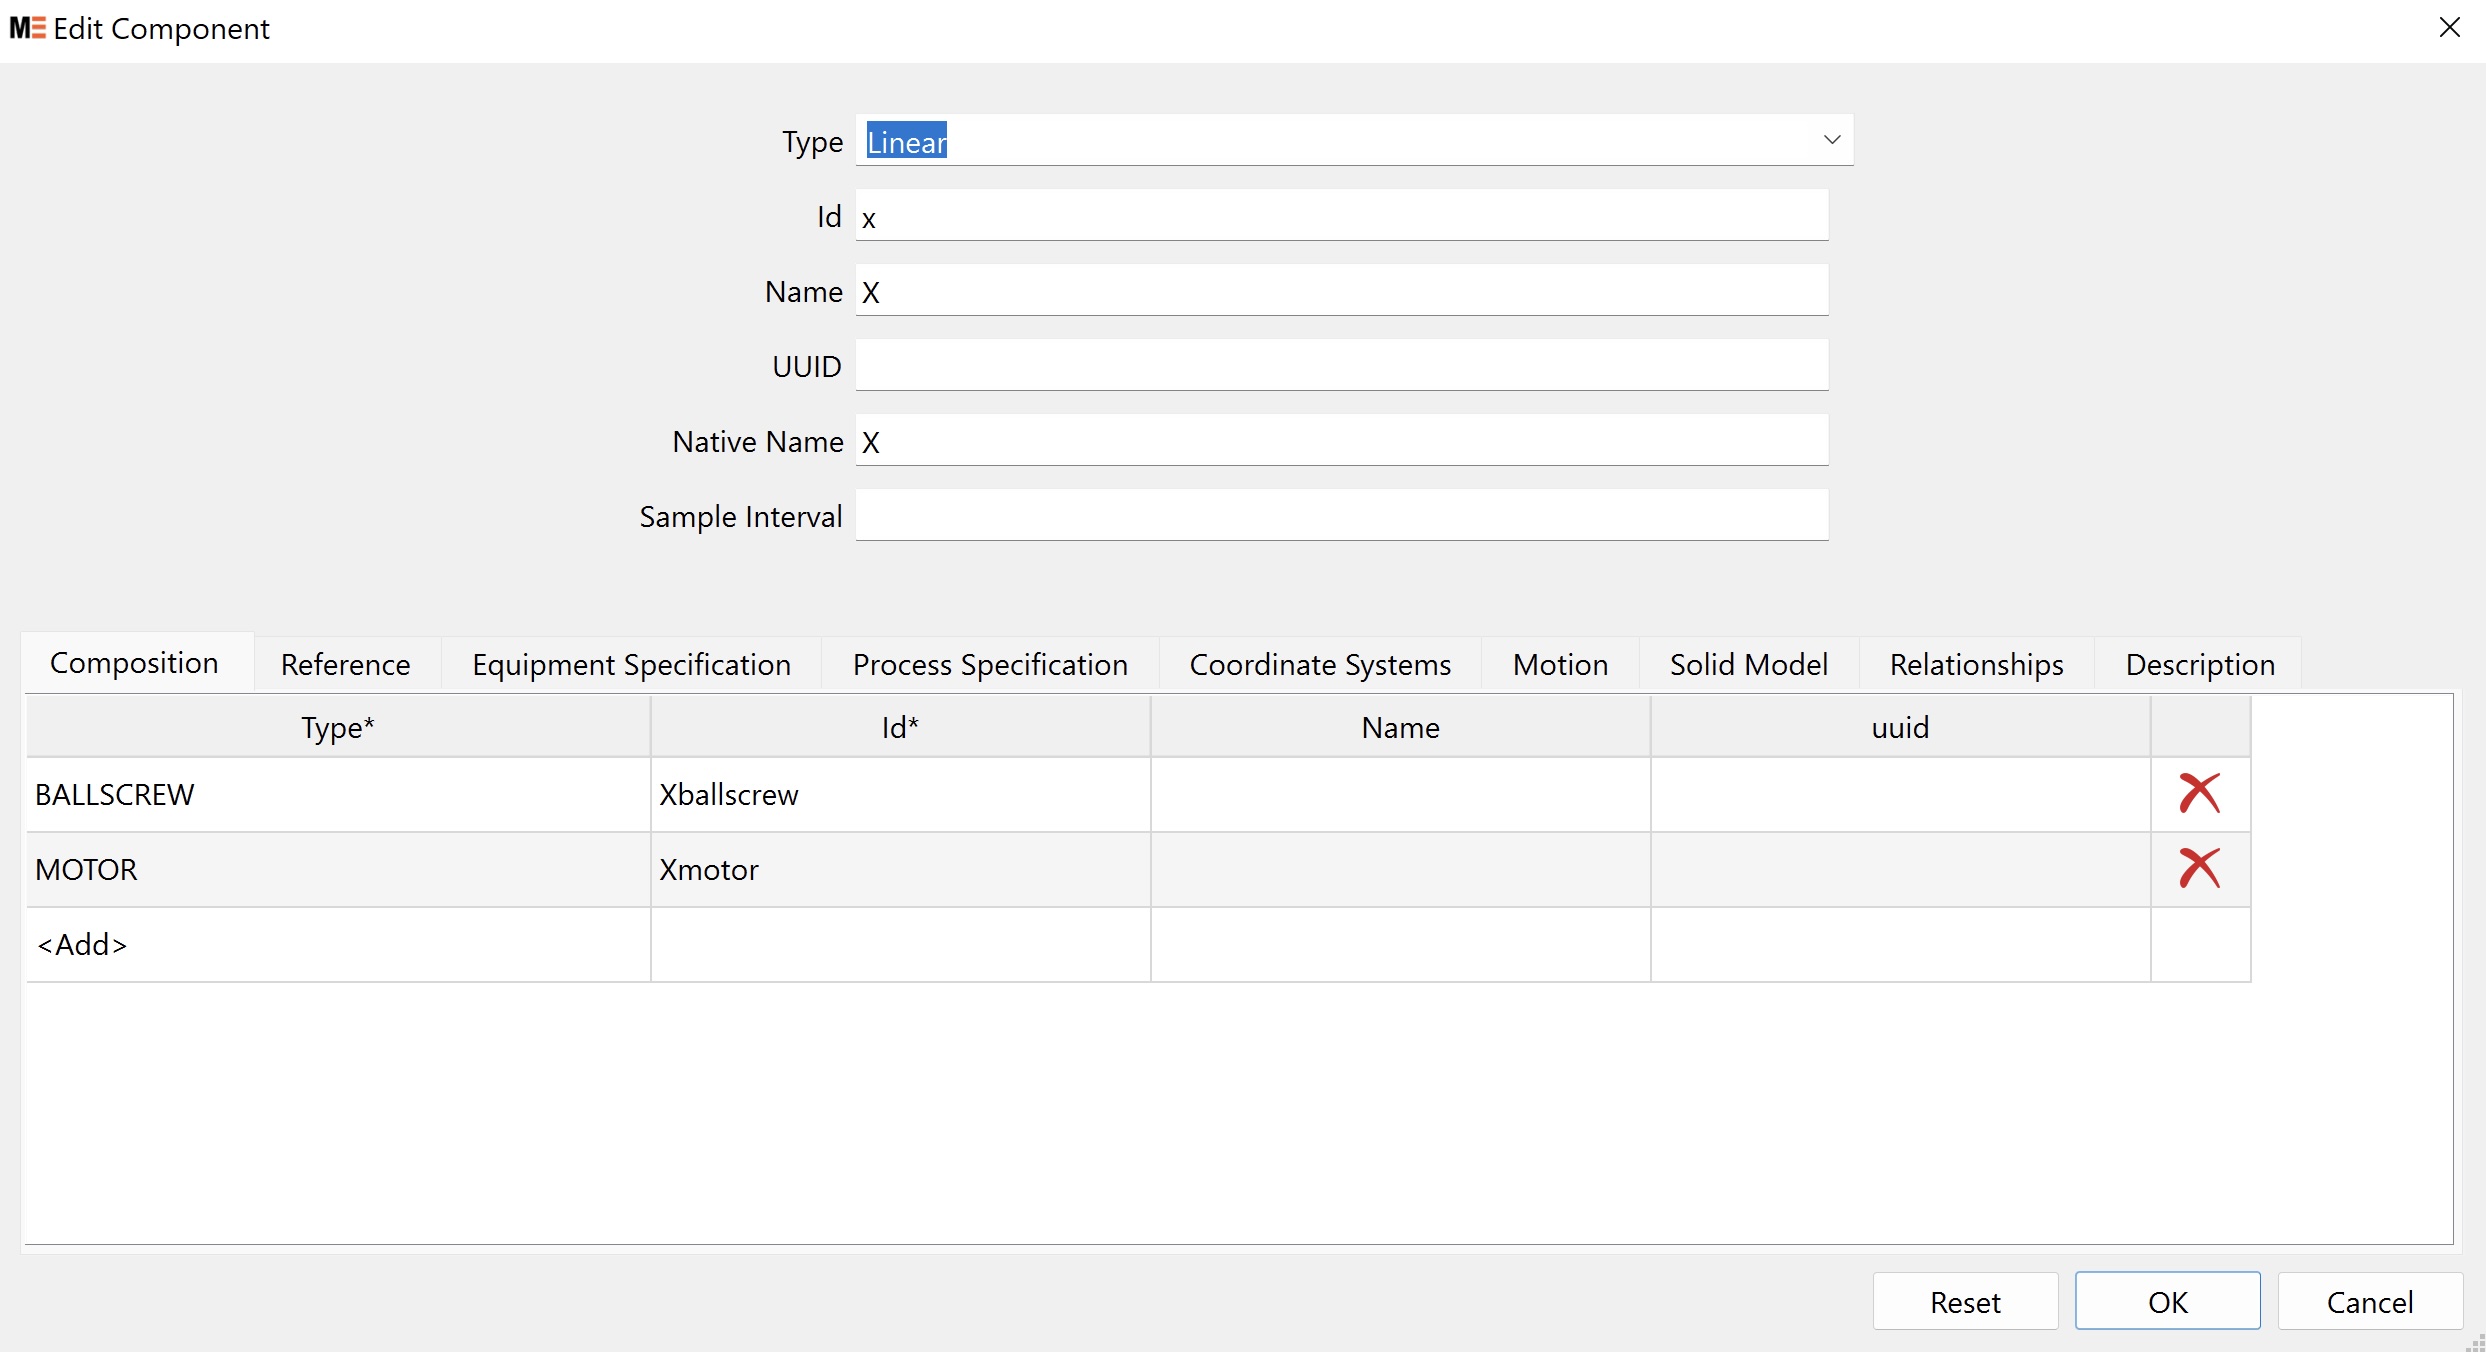
You can provide all the model info for a component including Composition, Reference, Equipment Specification, Process Specification, Coordinate Systems, Motion, Solid Model, Relationships, and Description as defined in MTConnect specification.
¶ Adding/Editing a Sample, Event, or Condition Data Item
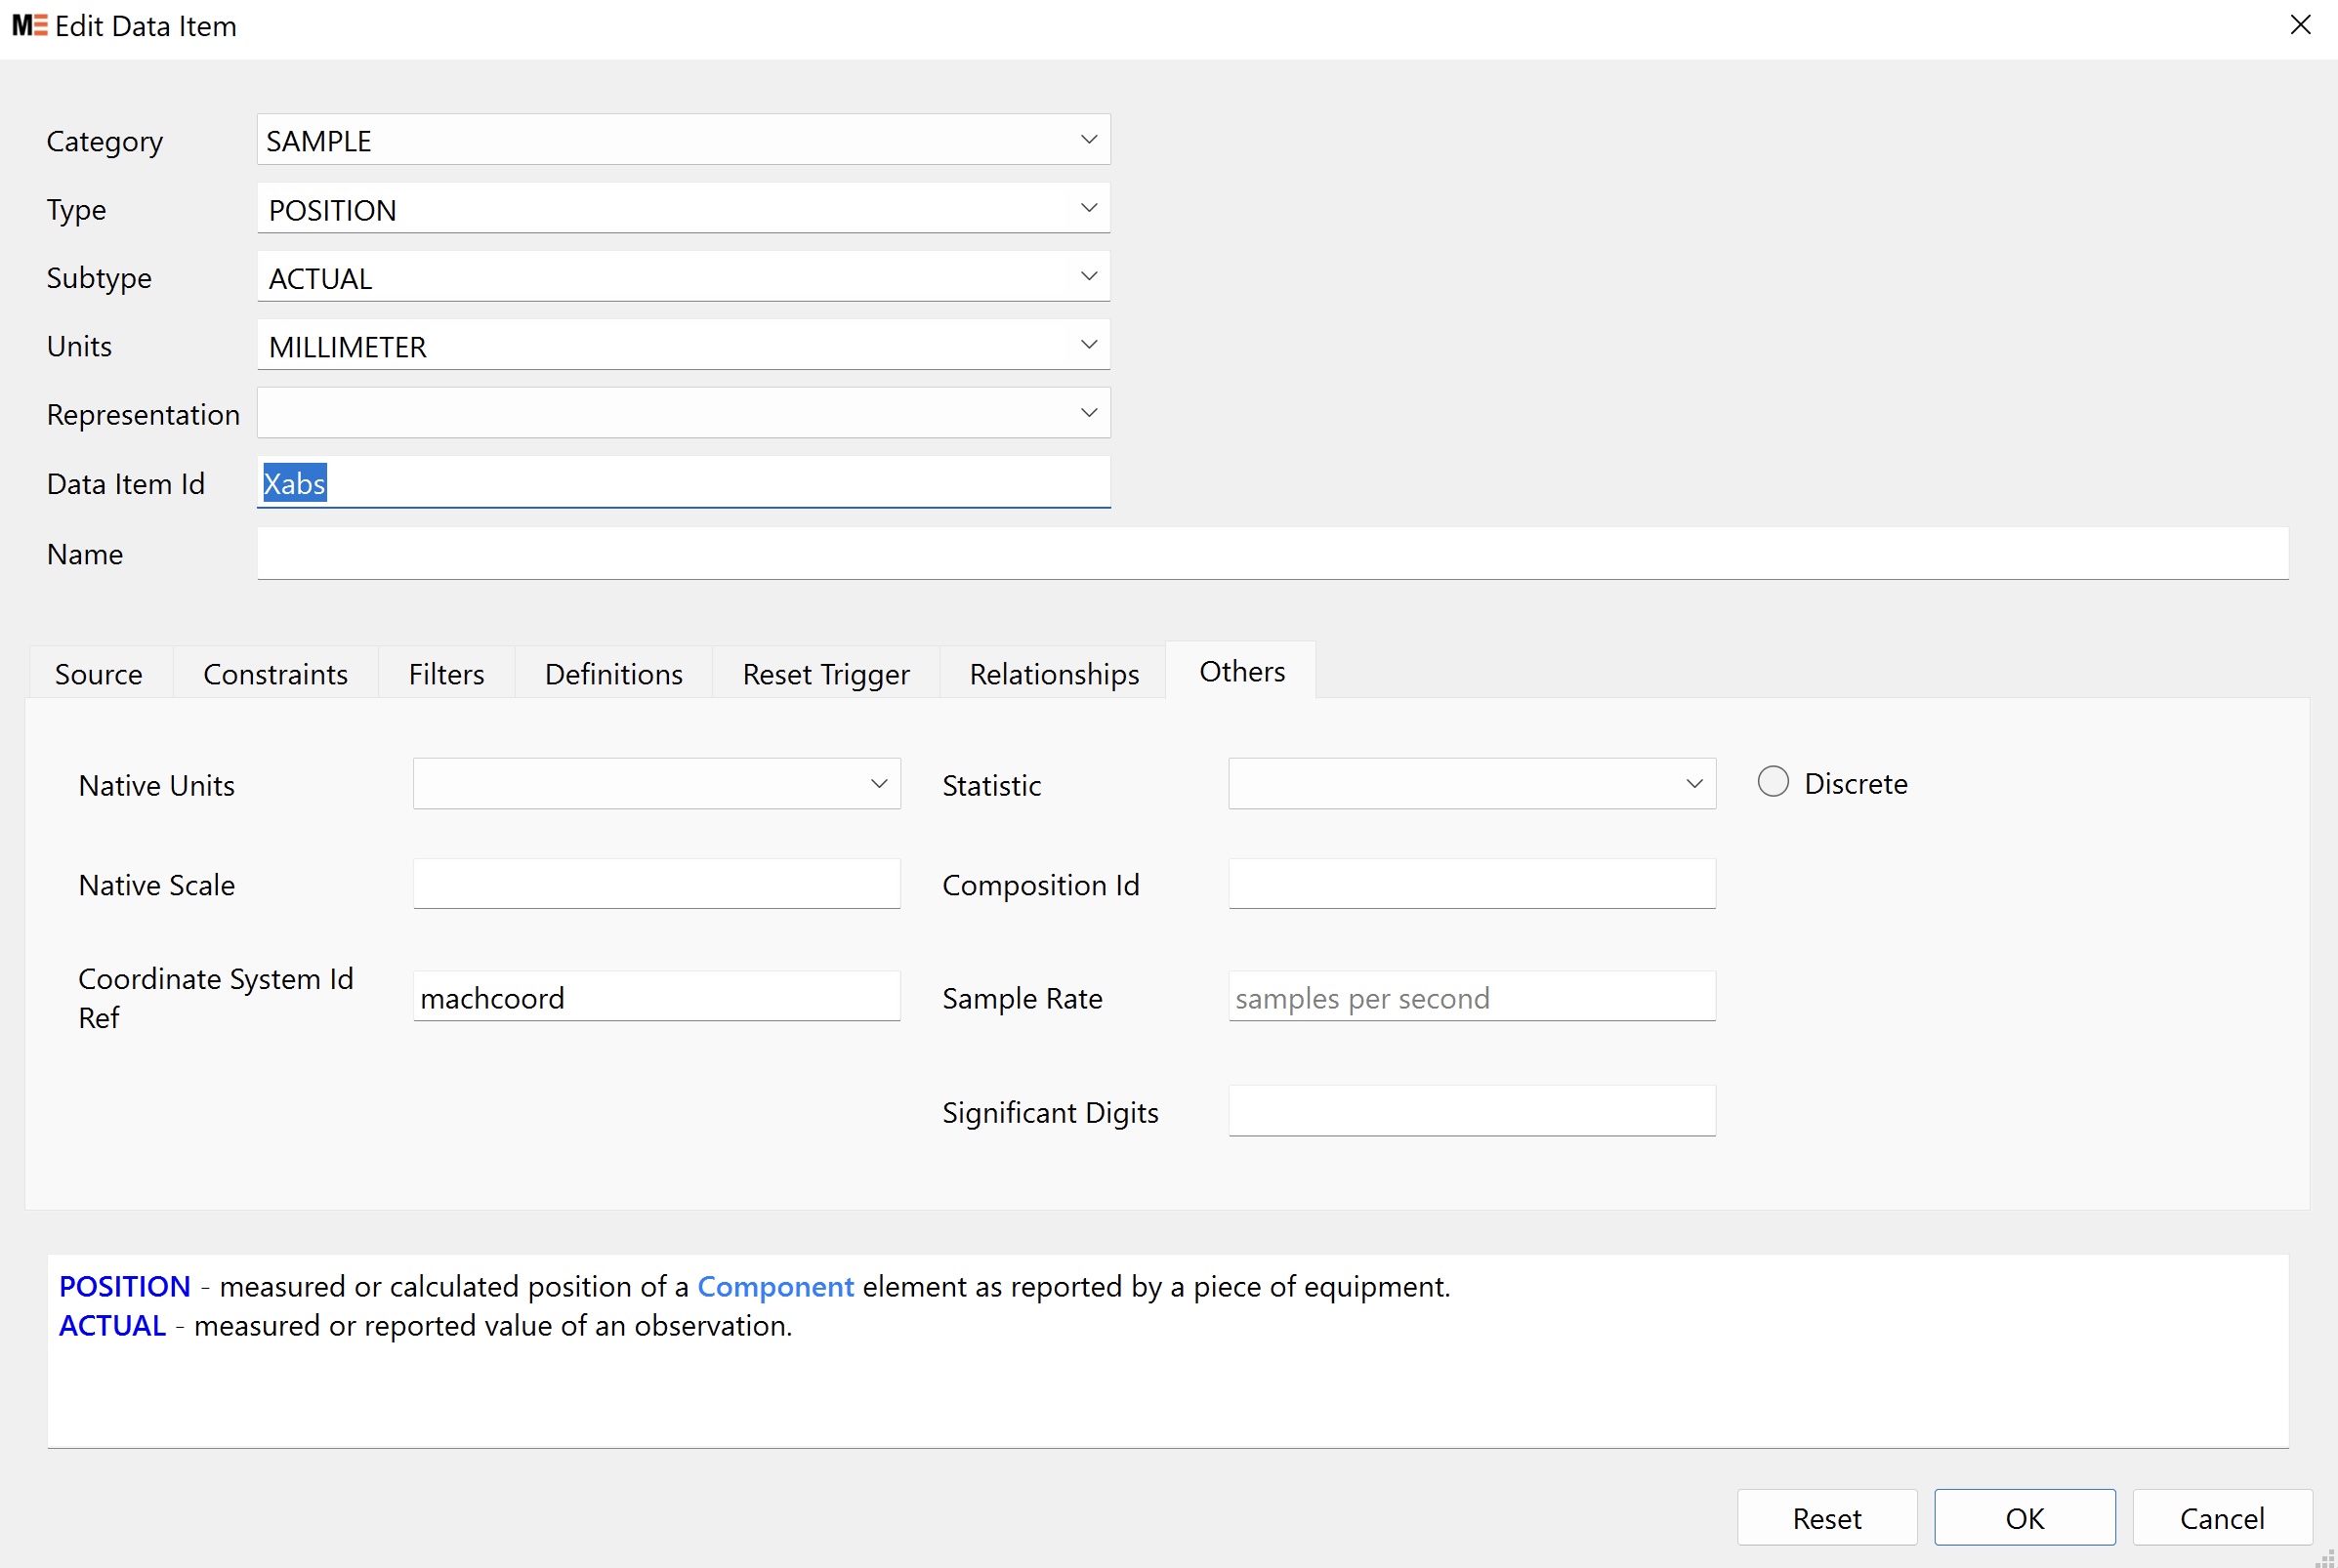
The data types native to MTConnect are Category Sample, Event, and Condition. Based on the selected data type, you can pick various Types and Subtypes. The info box at the bottom will be dynamically updated based on your selection. You can also update other associated model info for the data item in the menus below as defined in the MTConnect specification.
¶ Delete/Cut/Copy/Paste/Undo
Each component or data item can be easily deleted, duplicated, or moved to a different location in the model:
- Edit > Delete [Delete Key]
- Edit > Cut [Ctrl-X]
- Edit > Copy [Ctrl-C]
- Edit > Paste [Ctrl-P]. Note that the paste operation will adjust the item’s ID depending on if there is a conflict with existing items.
t any time, you can undo your last operation via Edit > Undo [Ctrl-Z]. You can repeat and undo as many operations as needed.
¶ Capturing the Model from the current Device
While viewing a device’s data in the Device Monitor Window, you can capture and edit the device’s model by selecting Composer > Edit Agent's Model [Alt-K].
After the model is captured, you can add/modify/delete any data items or components using the same procedure as above.
¶ Integrating with MetaAgent
You can integrate with MetaAgent to iteratively test-run your model configuration locally. MetaAgent provides extensions to the current MTConnect Agent and allows you to add other industrial standards or protocols like OPC UA, and NC-Link as incoming or outgoing interface modules. Additional outbound end-points like RethinkDB, InfluxDB, ElasticSearch, Kafka, and Sparkplug B are also supported.
¶ Installing MetaAgent
The MetaAgent release package contains the MTConnect agent and other ingress and egress plugins.
Windows- Simply follow the installer and add MetaAgent in the system PATH for all users.MacOS- Install it to~/MetaAgentor/Applications/MetaAgent. For other locations, update the system PATH to include the installed binary locationMetaAgent/bin.
¶ Configuring MetaAgent
When editing the model configuration, configure MetaAgent by selecting Composer > Open Agent Configuration. It will then prompt you for General Configuration, Inbound, and Outbound.
Inbound traffic can come from one of the Adapter Types: MTConnect, OPC UA, or NC-Link.
Outbound traffic can be MTConnect, OPC UA, NC-Link, RethinkDB, InfluxDB, ElasticSearch, Kafka, and Sparkplug B.
Common notations in the Configuration:
- The field is mandatory when its label has a “*” suffix.
- CheckBox “Enable” is an On/Off switch for the inbound/outbound module. If enabled, the tab will show a checkmark.
- For the Inbound module, check “Show Data” to show the incoming data in the right panel. Only one Inbound module's data can be shown at a time.
- The Inbound/Outbound module may have its own log file and log level. If not specified, it outputs logs to the default Agent's output log.
- LicenseKey field may be empty. If not entered, the inbound/outbound module will run in the demo mode. Request your license key from Metalogi.
¶ General Configuration
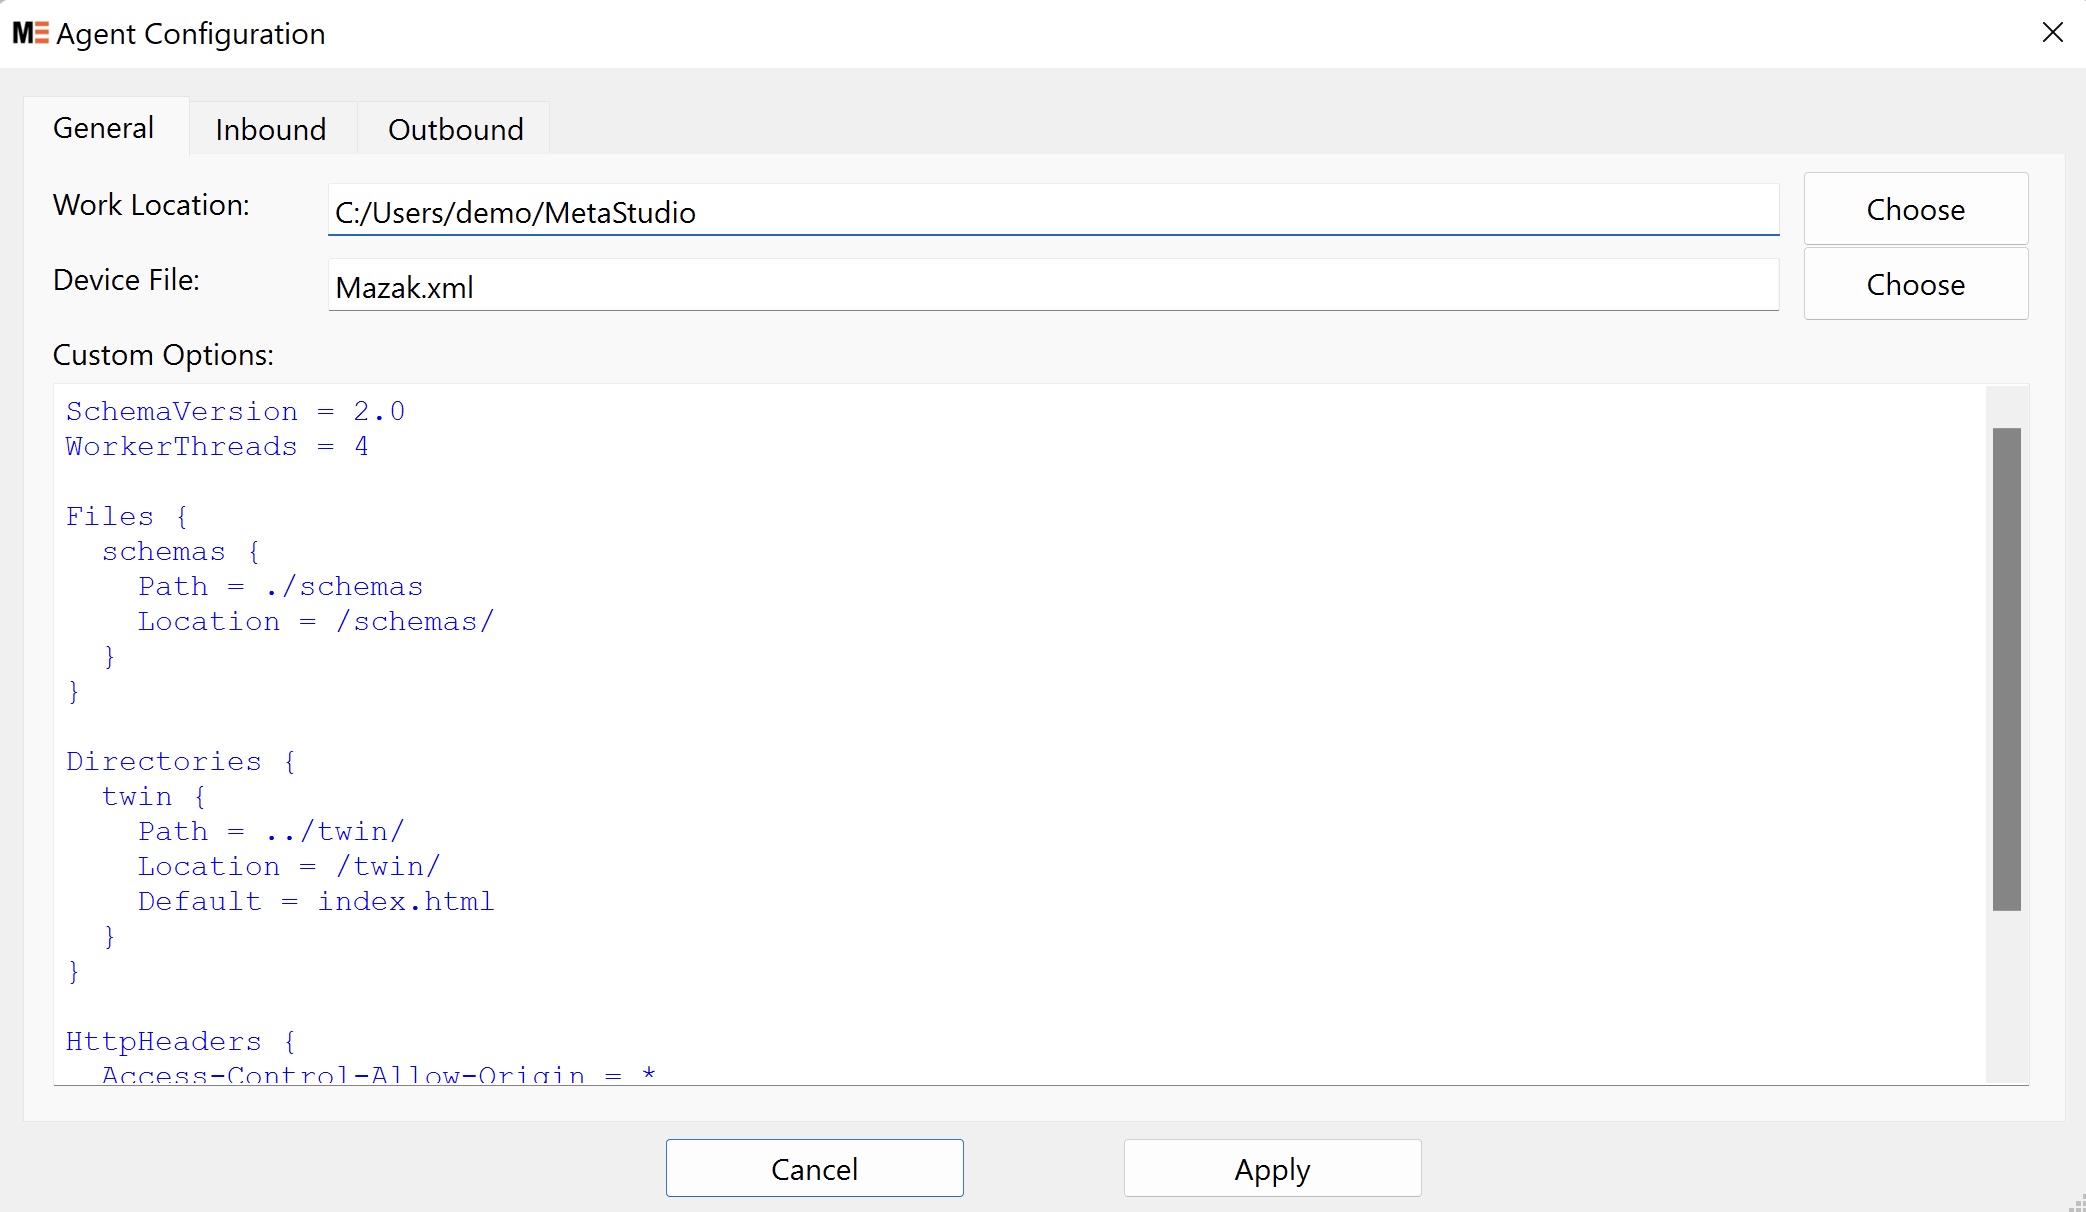
MetaAgent employs the same configuration as the standard MTConnect Agent. The configurations are specified in a configuration file agent.cfg. Please refer to the MTConnect Agent configuration for details.
When additional inbound/outbound modules are specified, MetaStudio simply appends its additional adapter and sink sections to the configuration file agent.cfg. The file is created using this info:
Work Location: Input the working directory for MetaAgent where the fileagent.cfgwill be generated. If not specified, the default location is $HOME/MetaStudio.Device File :Specify which device file is used in theagent.cfg.Custom Options: Specify any additional configuration info in theagent.cfg. This input and the adapter and sink sections are combined to generate theagent.cfg.
¶ Inbound - MTConnect
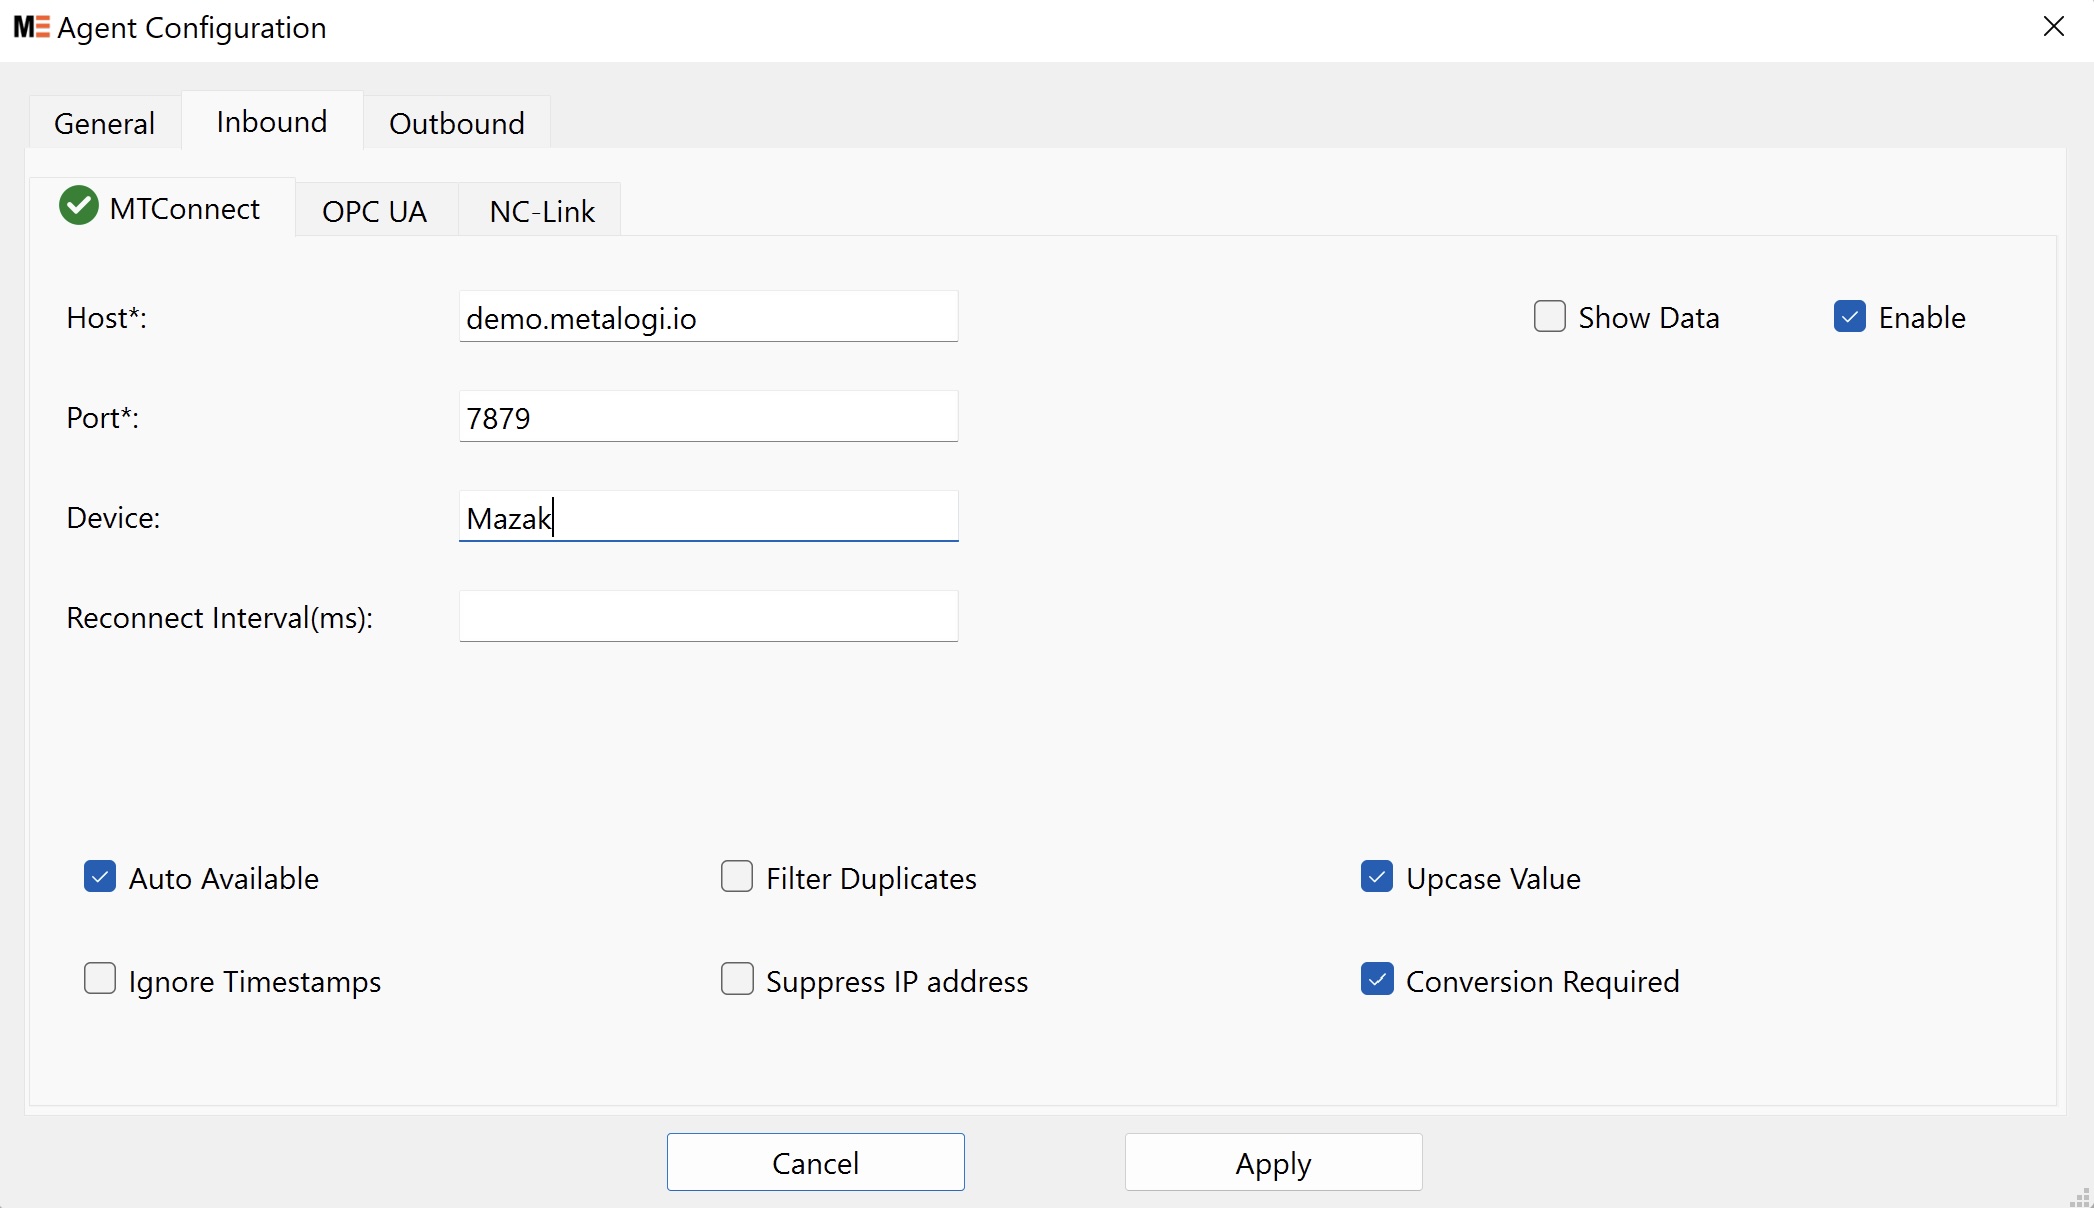
Device: This adapter's assigned nameReconnect Interval: The amount of time between adapter reconnection attempts. This is useful for implementing high-performance adapters where availability needs to be tracked in near-real-time. Time is specified in milliseconds (ms). Default: 10000Auto Available: For devices that cannot provide available events, if checked, this sets theAvailabilityto AVAILABLE upon connection. Default: no (new in 1.2, if AVAILABILITY is not provided for the device it will be automatically added and this will default to yes)Ignore Timestamps: Overwrite timestamps with the agent time. This will correct clock drift but will not give an accurate relative time since it will not take into consideration network latencies. This can be overridden on a per-adapter basis.Filter Duplicates: If checked, filter all duplicate values for data items. This is to support adapters that are not doing proper duplicate filtering.Suppress IP Address: Suppress the Adapter IP Address and port when creating the Agent Device IDs and names.Upcase Value: Always convert the value of the data items to upper case.Conversion Required: Adapter setting for data item unit conversion in the agent. Assumes the adapter has already done unit conversion.
¶ Inbound - OPC UA
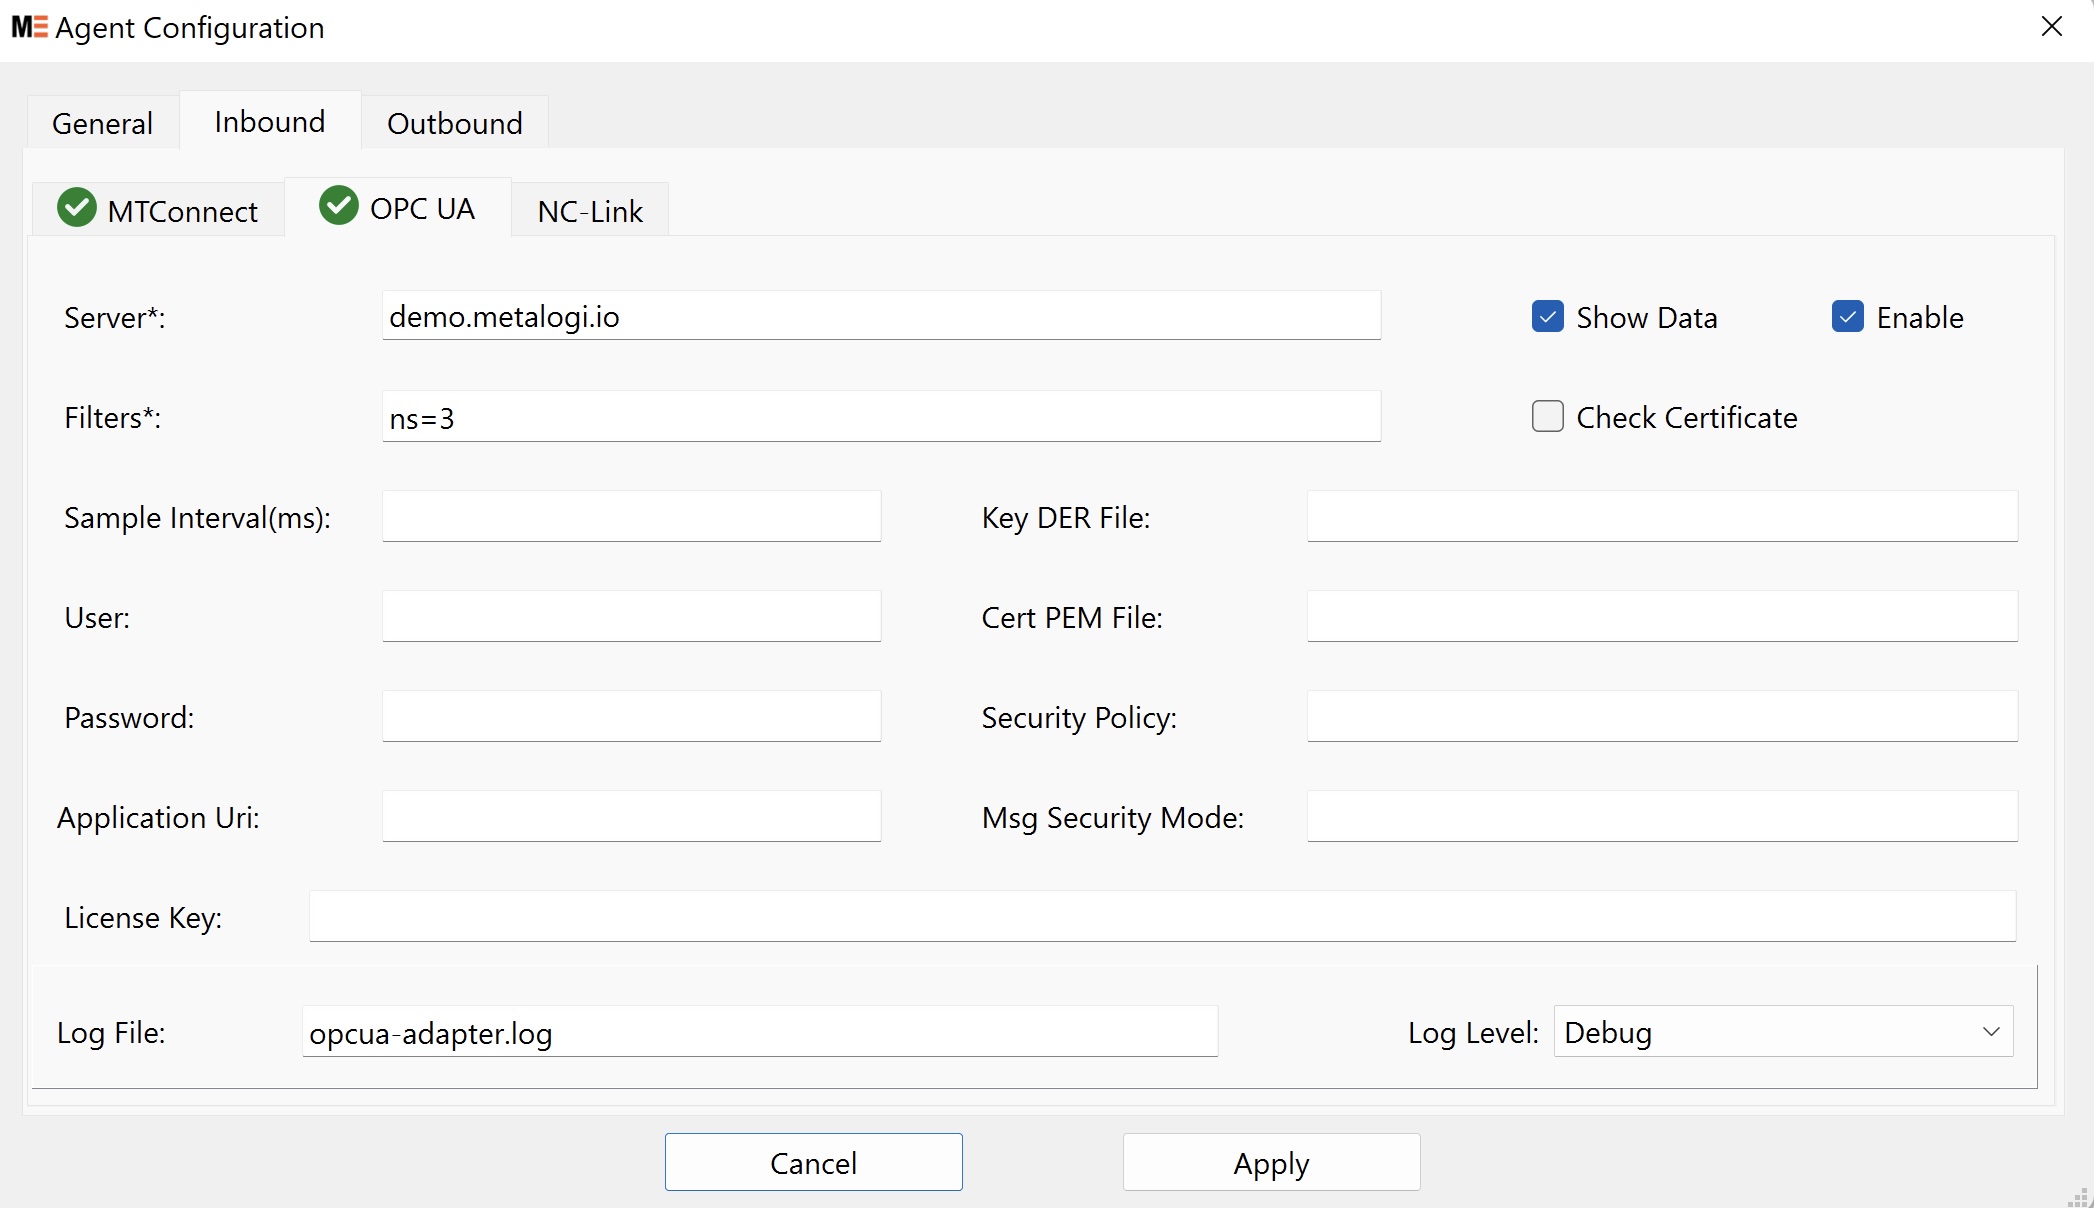
Server: OPC UA connection URL. An example isopc.tcp://milo.digitalpetri.com:62541/milo.opc.tcp://may be omitted.Filters: Specify data Selection as the top-level node’s id, like “ns=2;s=Dynamic” or comma-separated regex matching patterns like “ns=3,ns=4;s=deviceA”. Only data on or below these specified nodes will be selected.Sample Interval: Specify the fastest rate at which the OPC UA server’s monitored items should be evaluated. The default is 0, indicating it should use the fastest practical rate.User/Password: if not specified, use an anonymous login.Application Uri: The presented Uri info to the OPCUA server.Check Certificate: If unchecked, ignore any server certificate errors.Key/Cert File: The client certificate info for secured connection.Security Policy: Input None, Basic128Rsa15, Basic256, Basic256Sha256, or Aes128_Sha256_RsaOaep.Msg Security Mode: Input None, sign or sign&encrypt.
Please visit the MTConnect OPC UA Companion Spec website for more info.
¶ Inbound - NC-Link
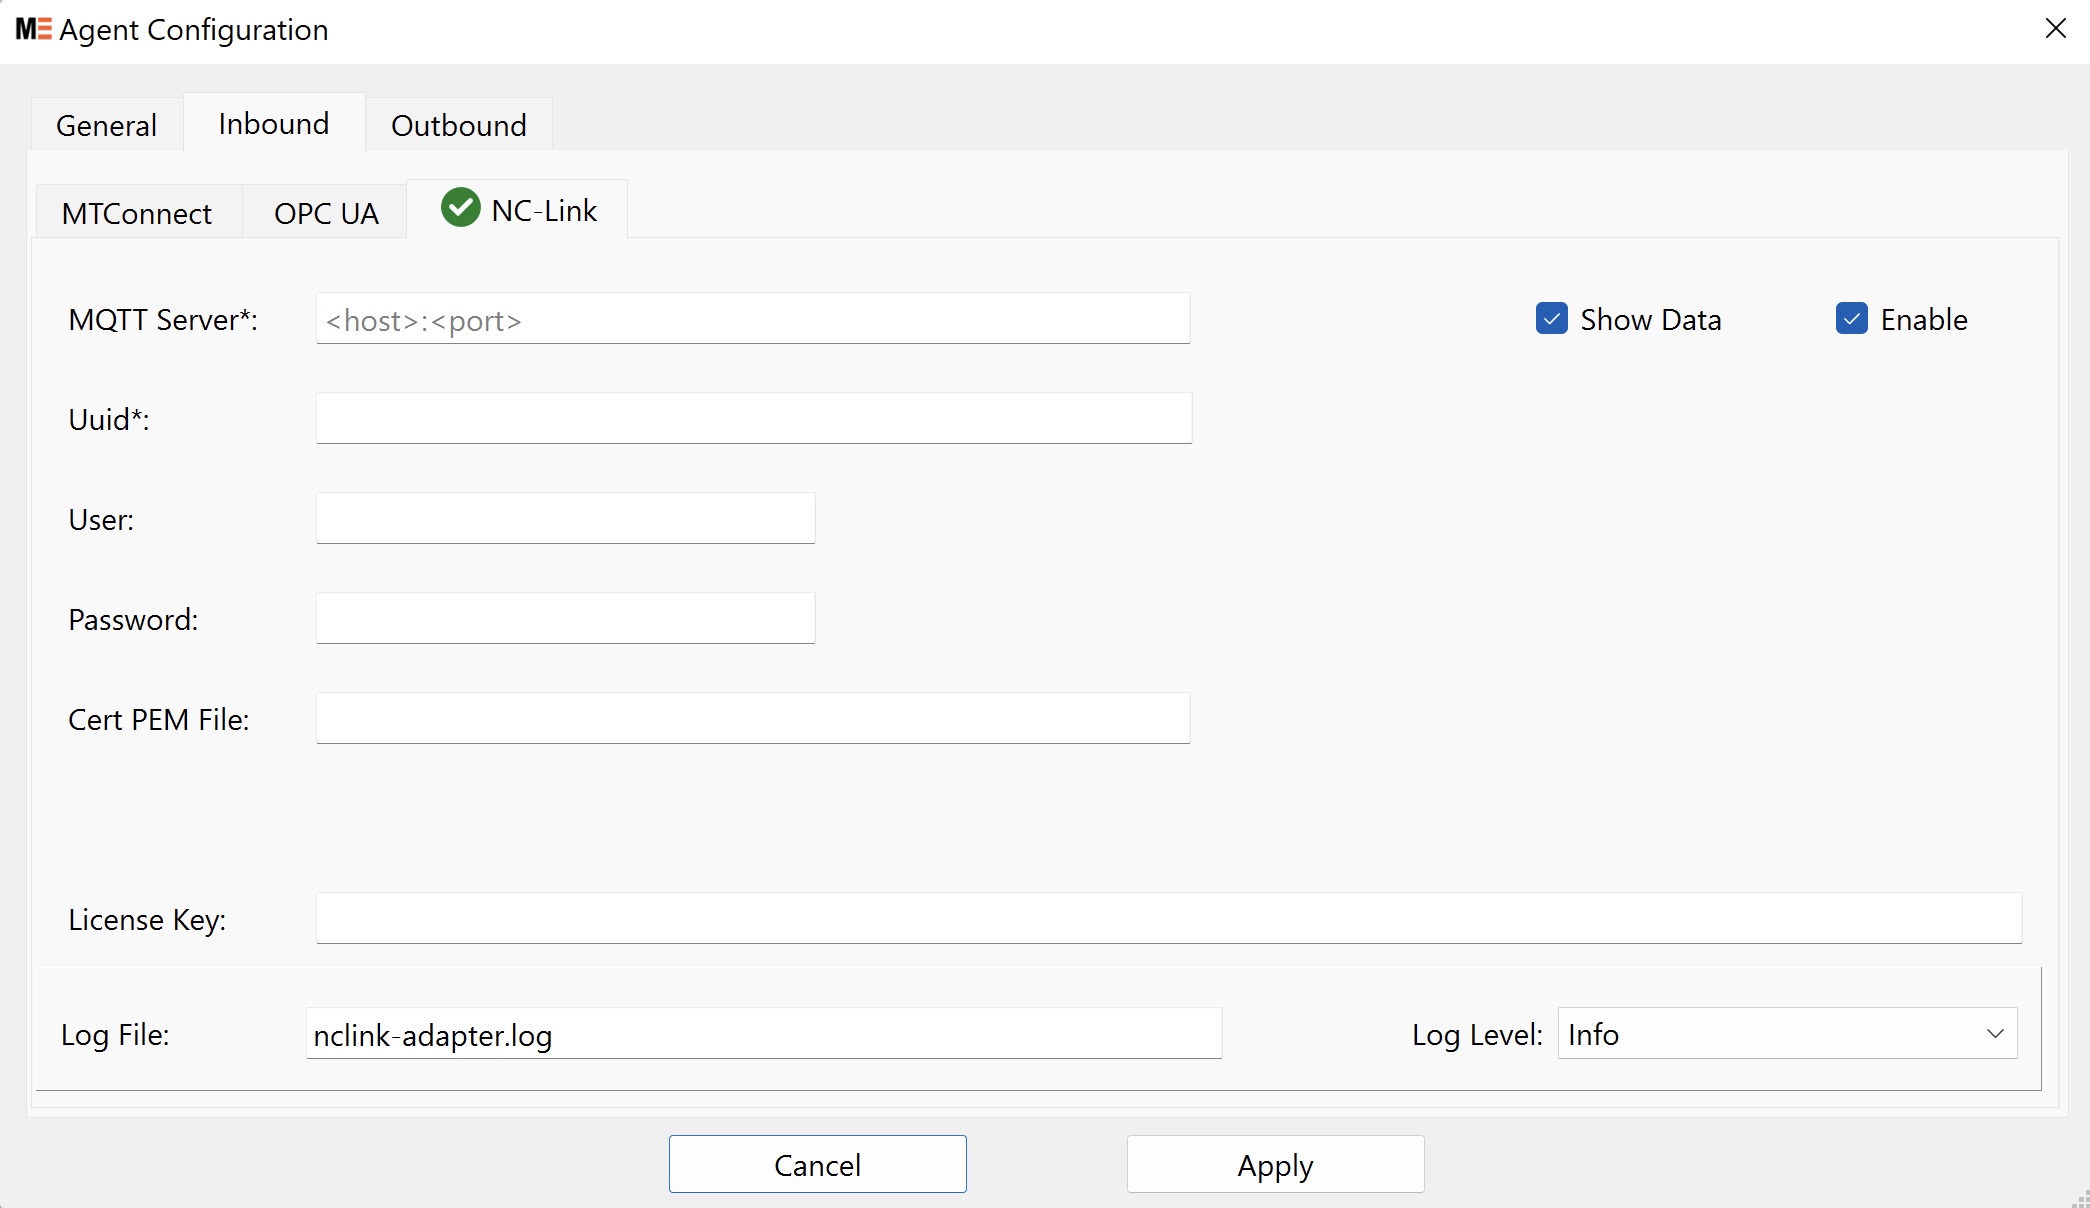
MQTT Server: The MQTT broker connection info as <host>:<port>Uuid: Select the selected device’s UUID as specified in the NC-Link specification. The MQTT server may be streaming data from multiple devices; this will filter out data only for this device.User/Password: if not specified, use an anonymous login.Cert PEM File: Client certificate file for secured connection.
Please visit the NC-Link standard from the China Machine Tool Builders Association (CMTBA) for more info.
¶ Outbound - MTConnect
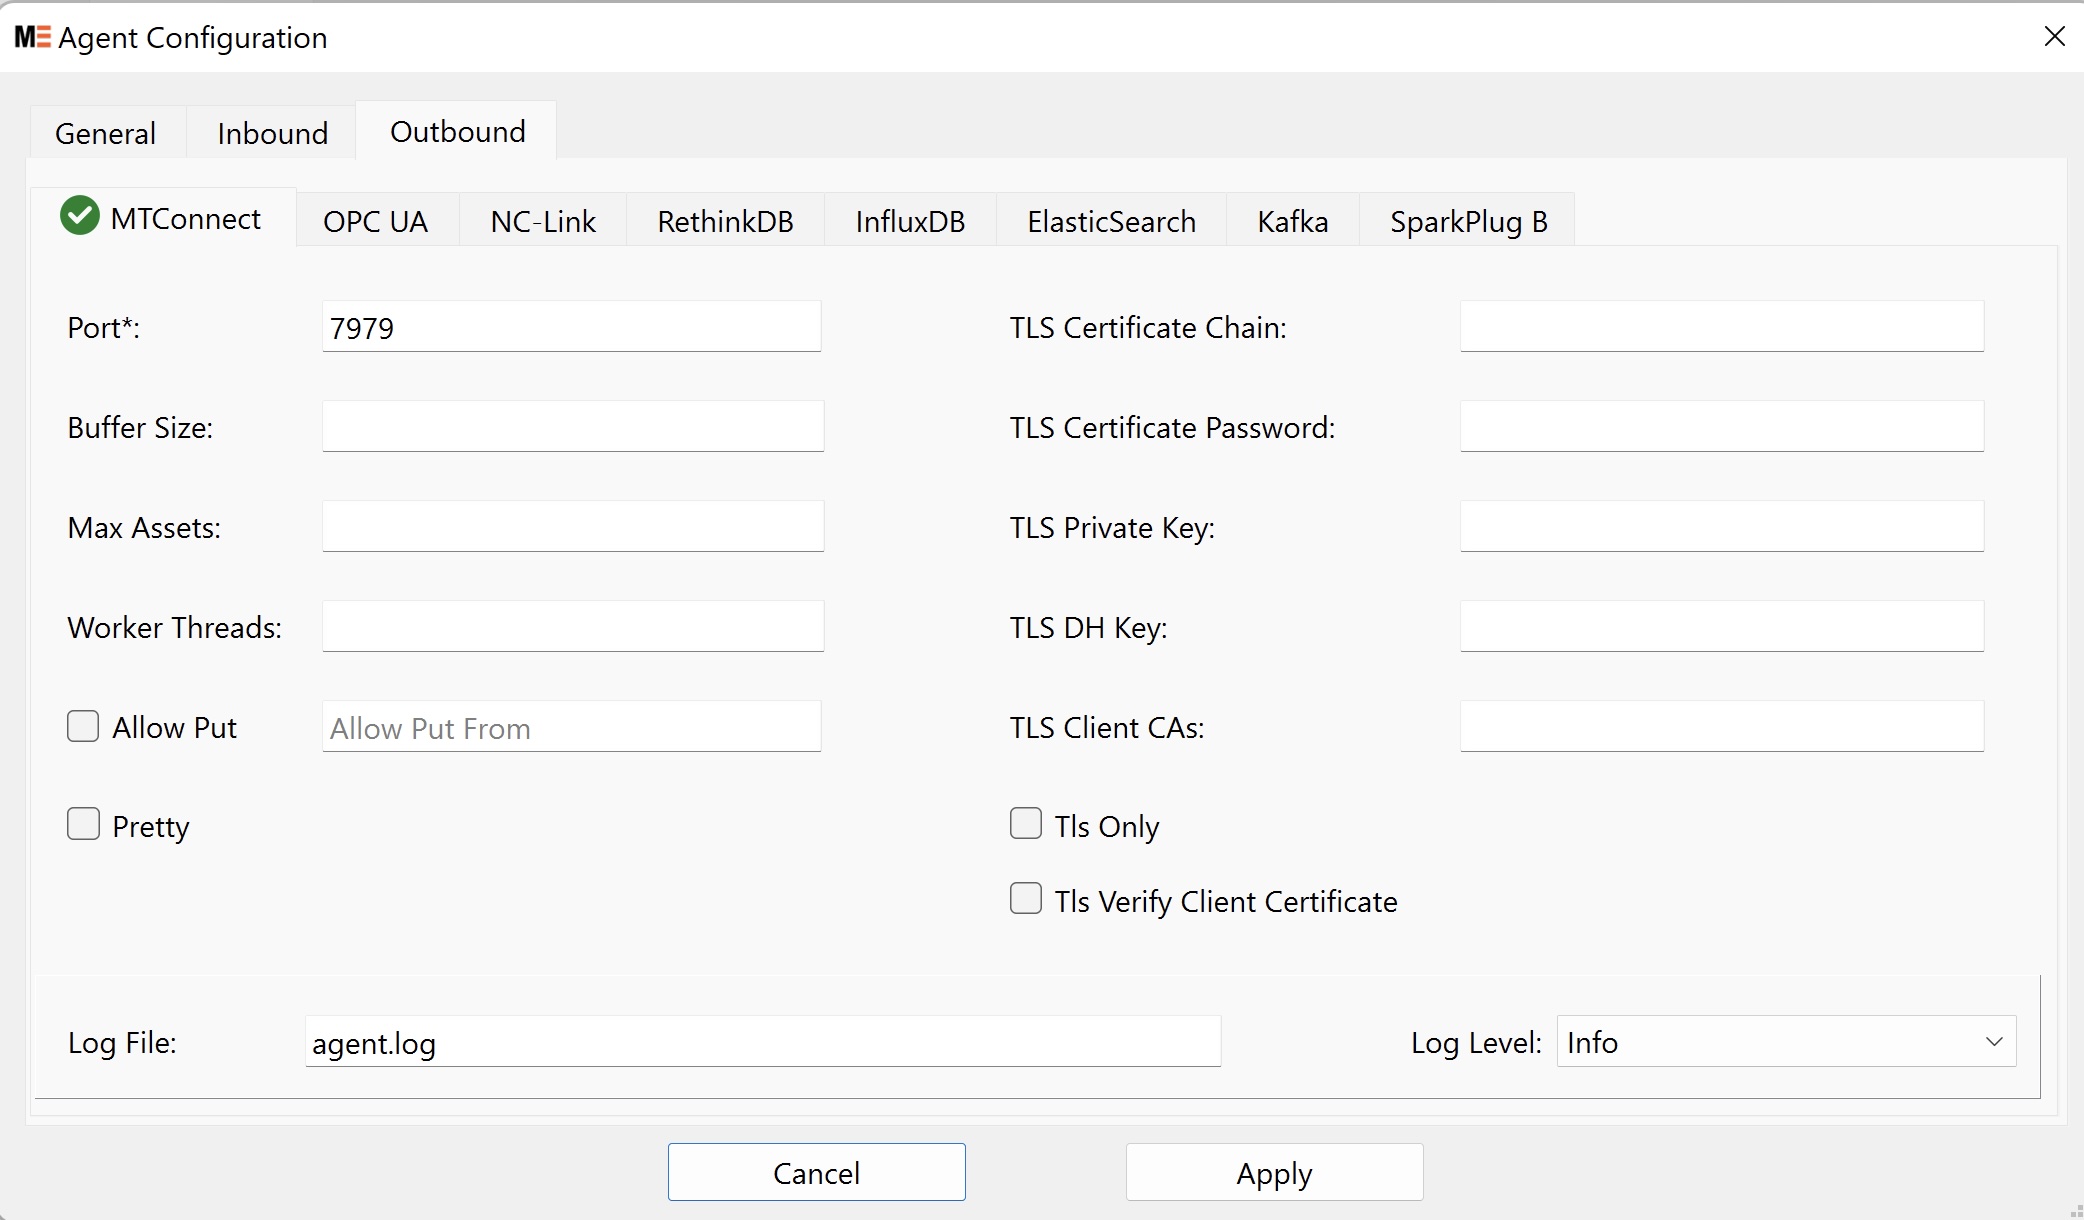
Port: The port number the agent binds to for requests.Buffer Size: The 2^X number of slots available in the circular buffer for samples, events, and conditions. Default: 17 -> 2^17 = 131,072 slots.Max Assets: The maximum number of assets the agent can hold in its buffer. The number is the actual count, not an exponent. Default: 1024Worker Threads: The number of operating system threads dedicated to the Agent. Default: 1Allow Put: Allow HTTP PUT or POST of data item values or assets.Allow Put From: Allow HTTP PUT or POST from a specific host or list of hosts. Lists are comma (,) separated and the host names will be validated by translating them into IP addresses.Pretty: Pretty print the output with indentation.Tls Certificate Chain: Specifies a file with a certificate inPEMformat for the REST server. If any intermediate certificates are required, they should first be provided with the primary certificate followed by the intermediate certificates in order.Tls Certificate Password: The password for the private key if required.Tls Private Key: The file containing the secret key inPEMformat.Tls DH Key: The file containing the Diffie–Hellman (D-H) parameters for the key exchange.Tls Client CAs: A set of certificate authorities for client certificate authentication. This is used when a self-signing client certificate is used.Tls Only: Reject any request that does not use TLS (https) to access the server.Tls Verify Client Certificate: Require the client certificate to be validated against root certs.
¶ Outbound - OPC UA
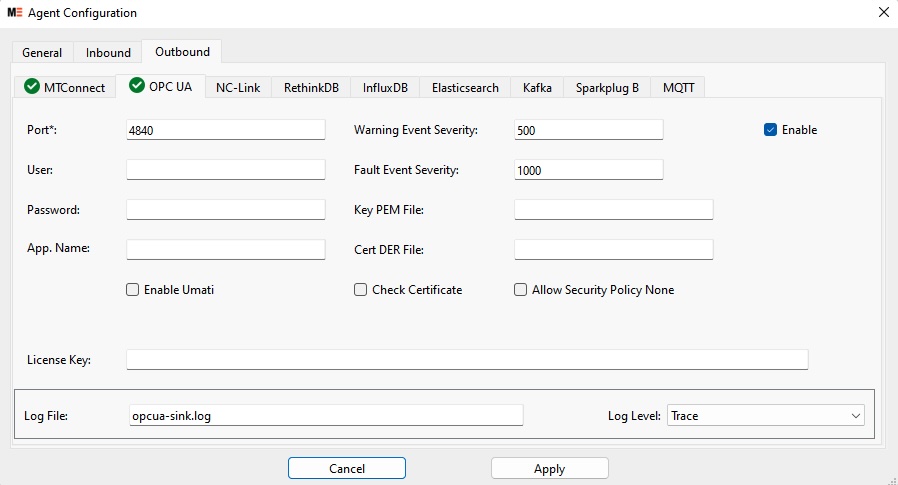
Port: The port number that the OPC UA server will serve.User/Password: If not specified, allow anonymous login.App. Name: Show this name in OPC UA Discovery.Warning Event Severity: OPC UA event severity level for MTConnect Warning conditions.Fault Event Severity: OPC UA event severity level for MTConnect Fault conditionsKey/Cert File: Server certificate and its key file used in establishing the secured connections. If they are valid, it allows secured connections of all security policies.Check Certificate: Validate the client's certificate during the secured connection.Allow Security Policy None: If checked, allow an unsecured connection option also.Enable Umati: Provide Umati showcase umati.app's related data items. See specification detailshttps://showcase.umati.org/Server.html
Please visit the MTConnect OPC UA Companion Spec website for more info.
¶ Outbound - NC-Link
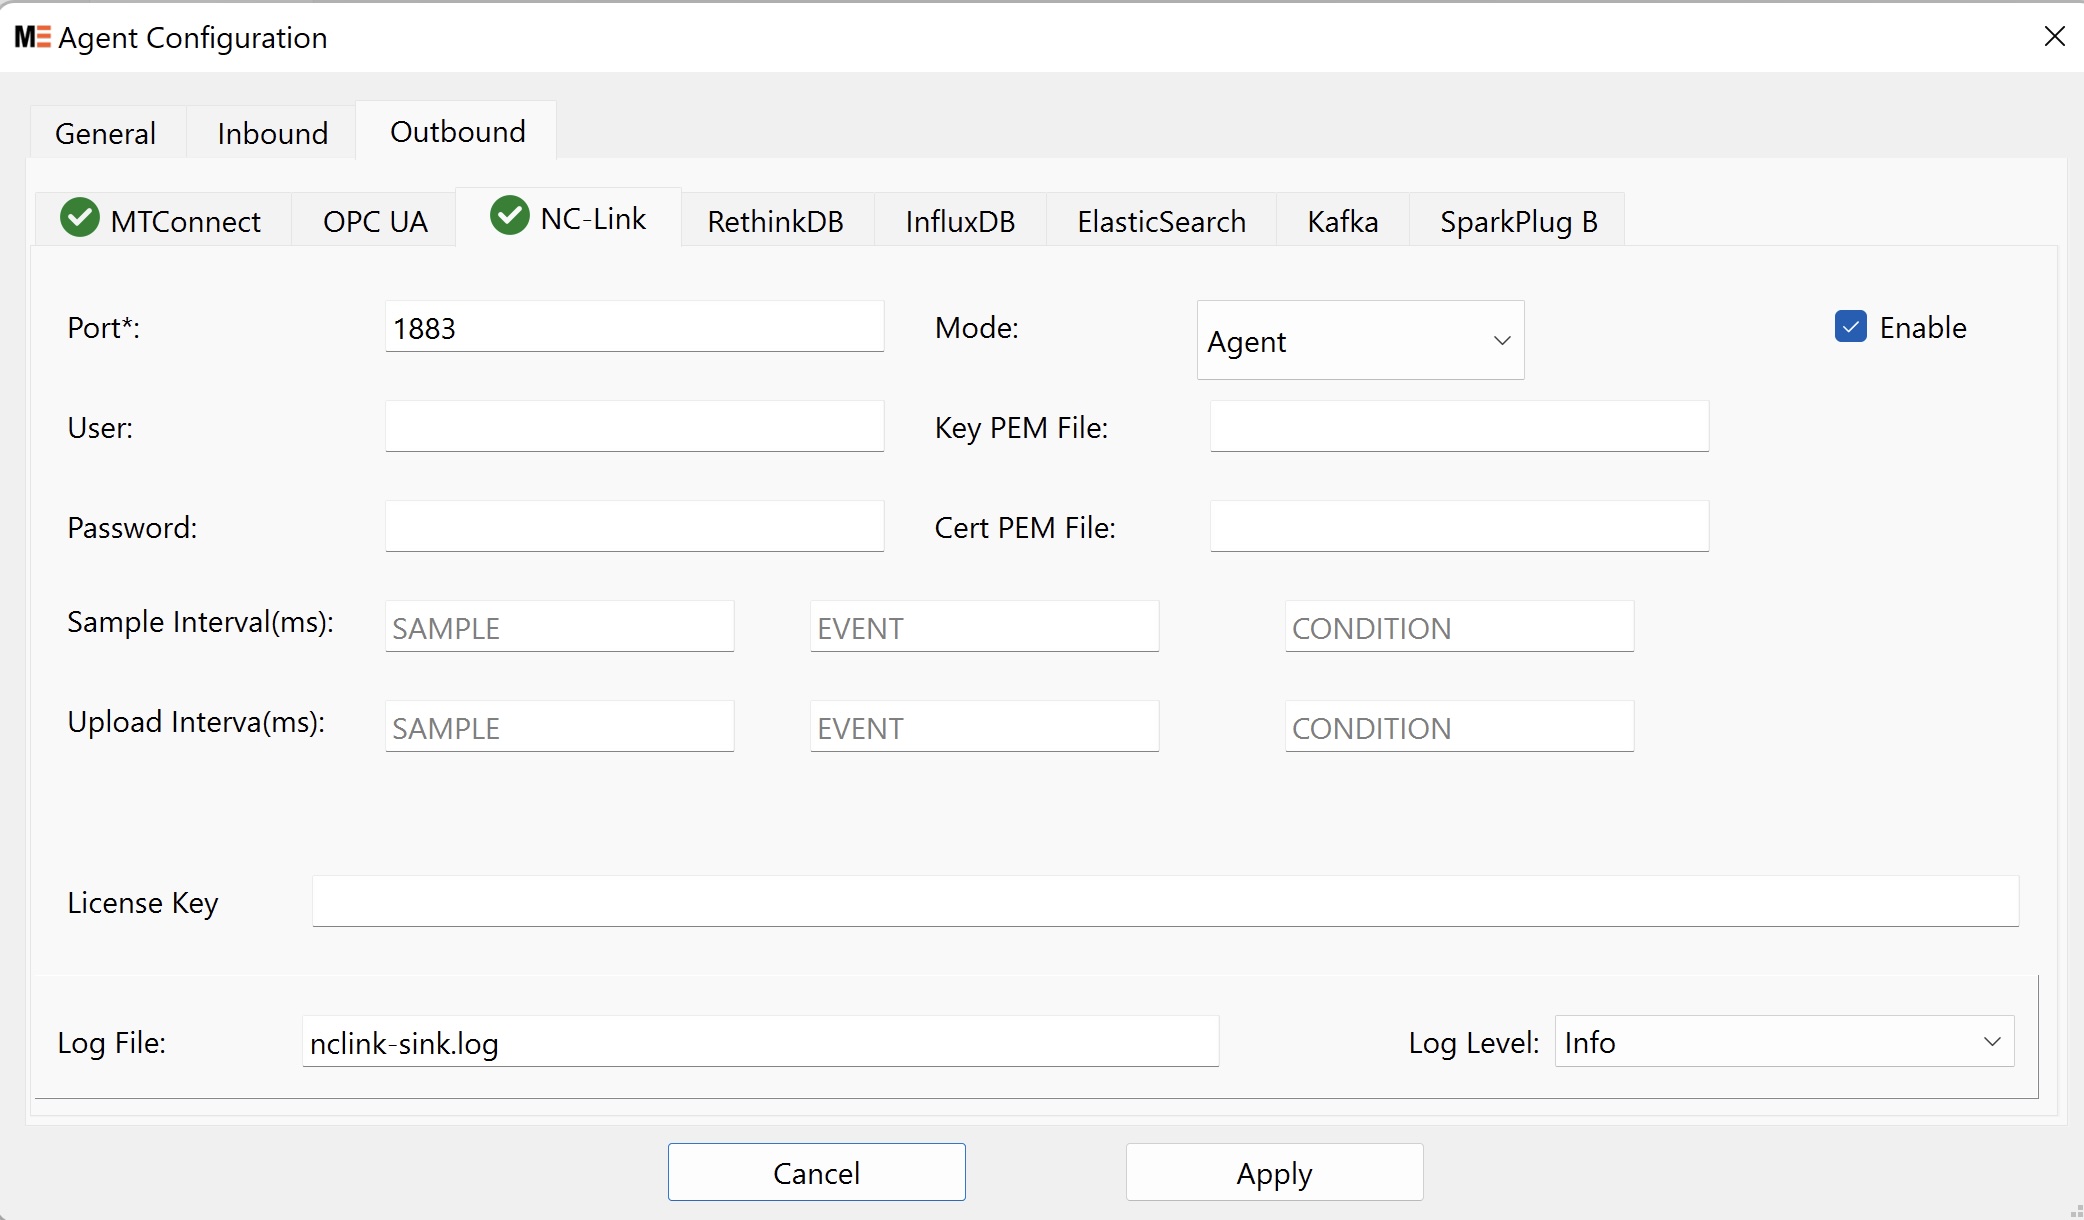
Port: The port number that the OPC UA server will serve.User/Password: If not specified, use an anonymous login.Mode: SelectAgentorAdapter.- The
Agentmode is to incorporate the MQTT broker as part of the NC-Link server. Key/Cert fields will be displayed.Key/Cert File: MQTT server's certificate and its key file.
- The
Adaptermode is to connect to an external MQTT broker. MQTT server and CA Cert File fields will be displayed.MQTT Server: the hostname of the external MQTT broker.CA Cert PEM File: CA cert file for the client connection.
- The
Sample Interval: Specify the time interval of sampling the data.Upload Interval: Specify the time interval of publishing the data. Upload Interval must be equal or greater than Sample Interval.
Please visit the NC-Link standard from the China Machine Tool Builders Association (CMTBA) for more info.
¶ Outbound - RethinkDB Realtime Database
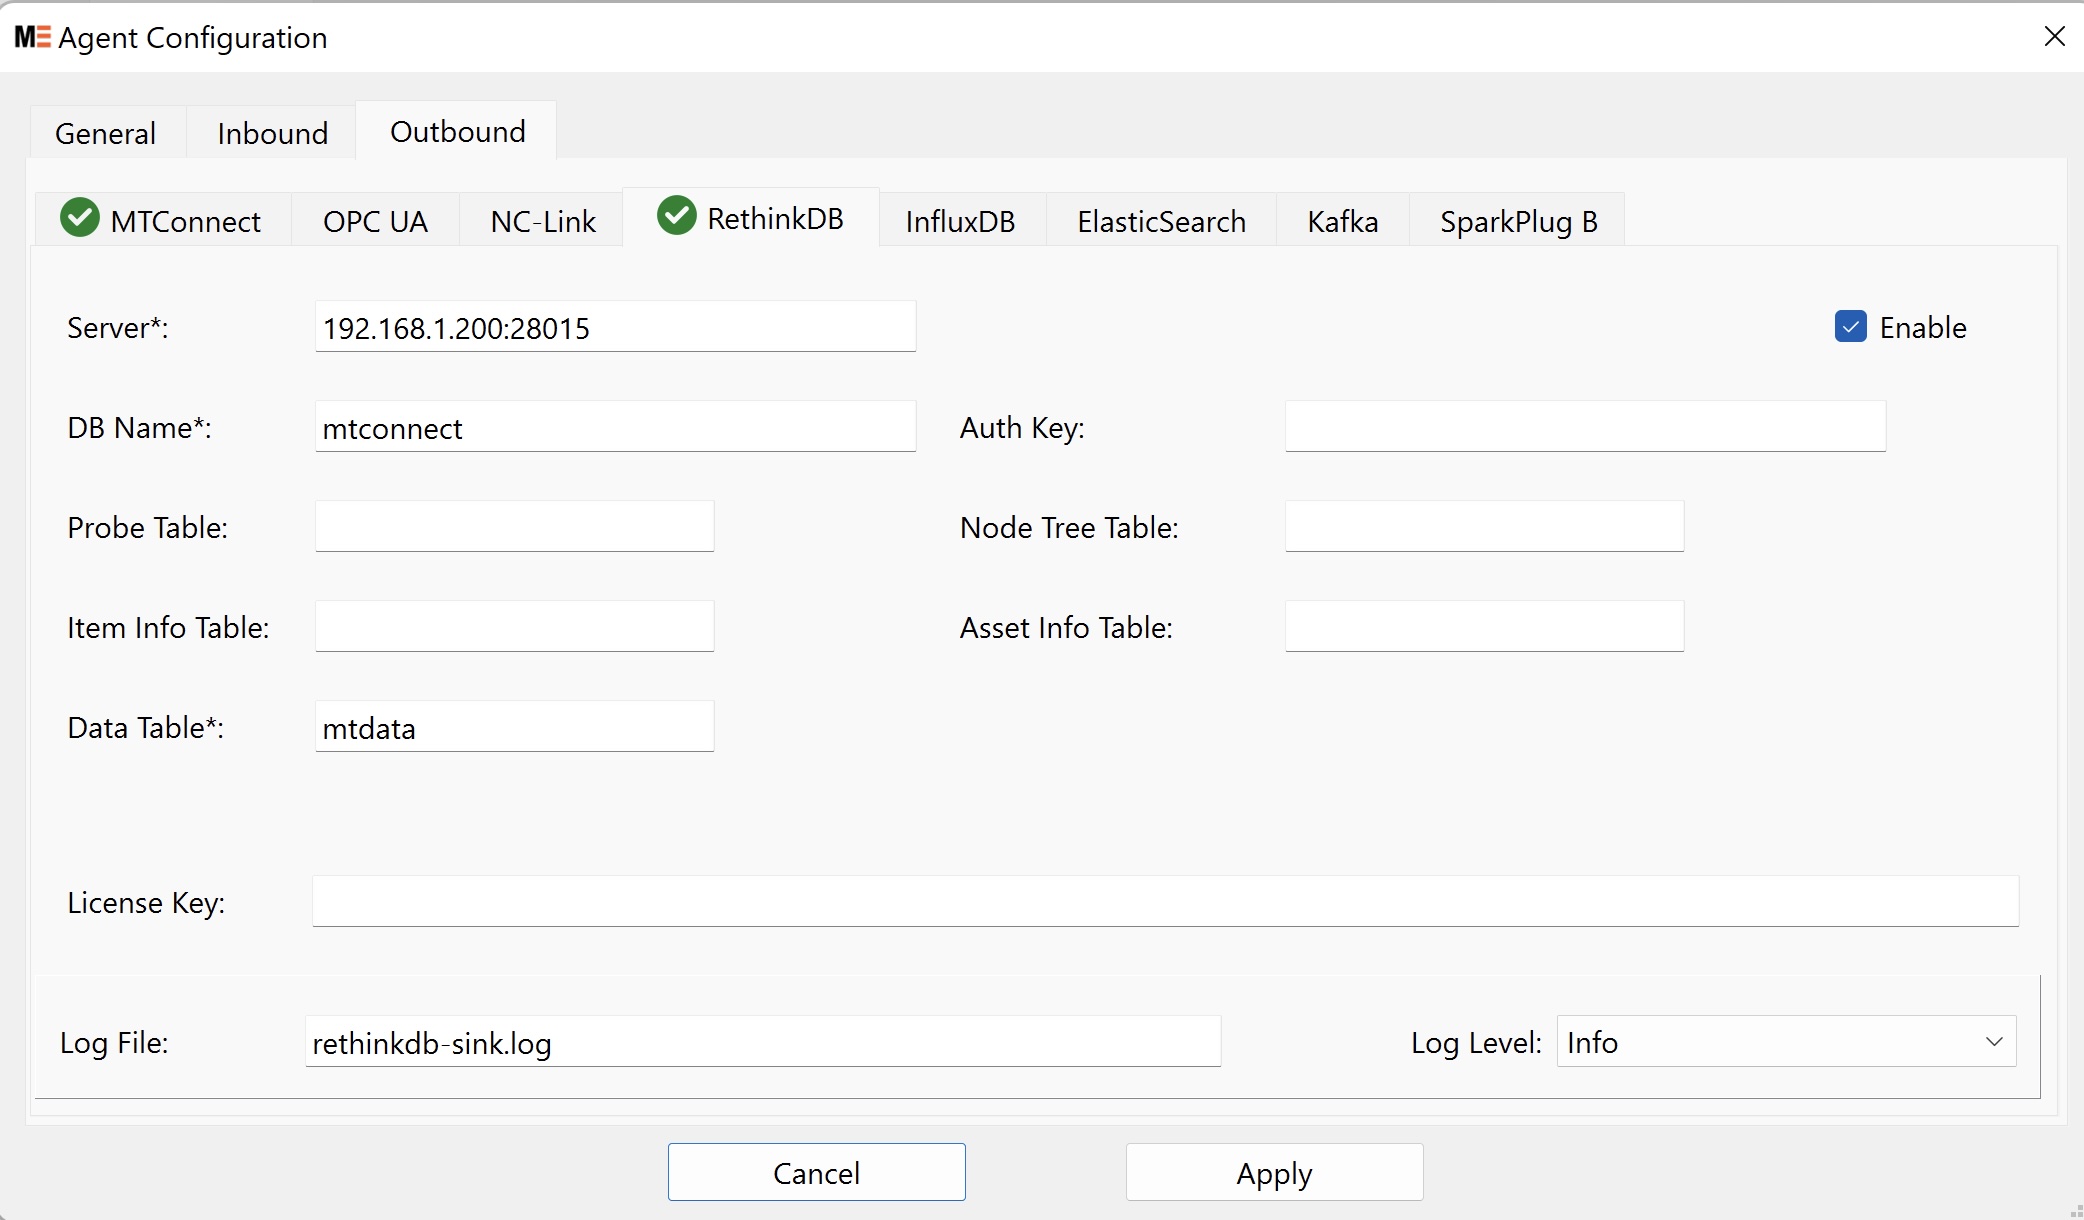
Server: RethinkDB client driver connection info in <host name>:<port #>DB Name: Target Rethink DB database nameAuth Key: RethinkDB connection authorization keyProbe Table: Specify the table to store the metadata of the Agent's machine. Skip if this field is not specified.Node Tree Table: Specify the table to store the unified data selection tree constructed from the metadata. Skip if this field is not specified.Item Info Table: Specify the table to store the type info for each data item. Skip if this field is not specified.Asset Info Table: Specify the table to store the asset info in the Agent's data stream. Skip if this field is not specified.Data Table: Specify the table to store the Samples, Events, and Condition real-time data.
Please visit the RethinkDB Realtime Database website for setup info.
¶ Outbound - InfluxDB Times Series Data Platform
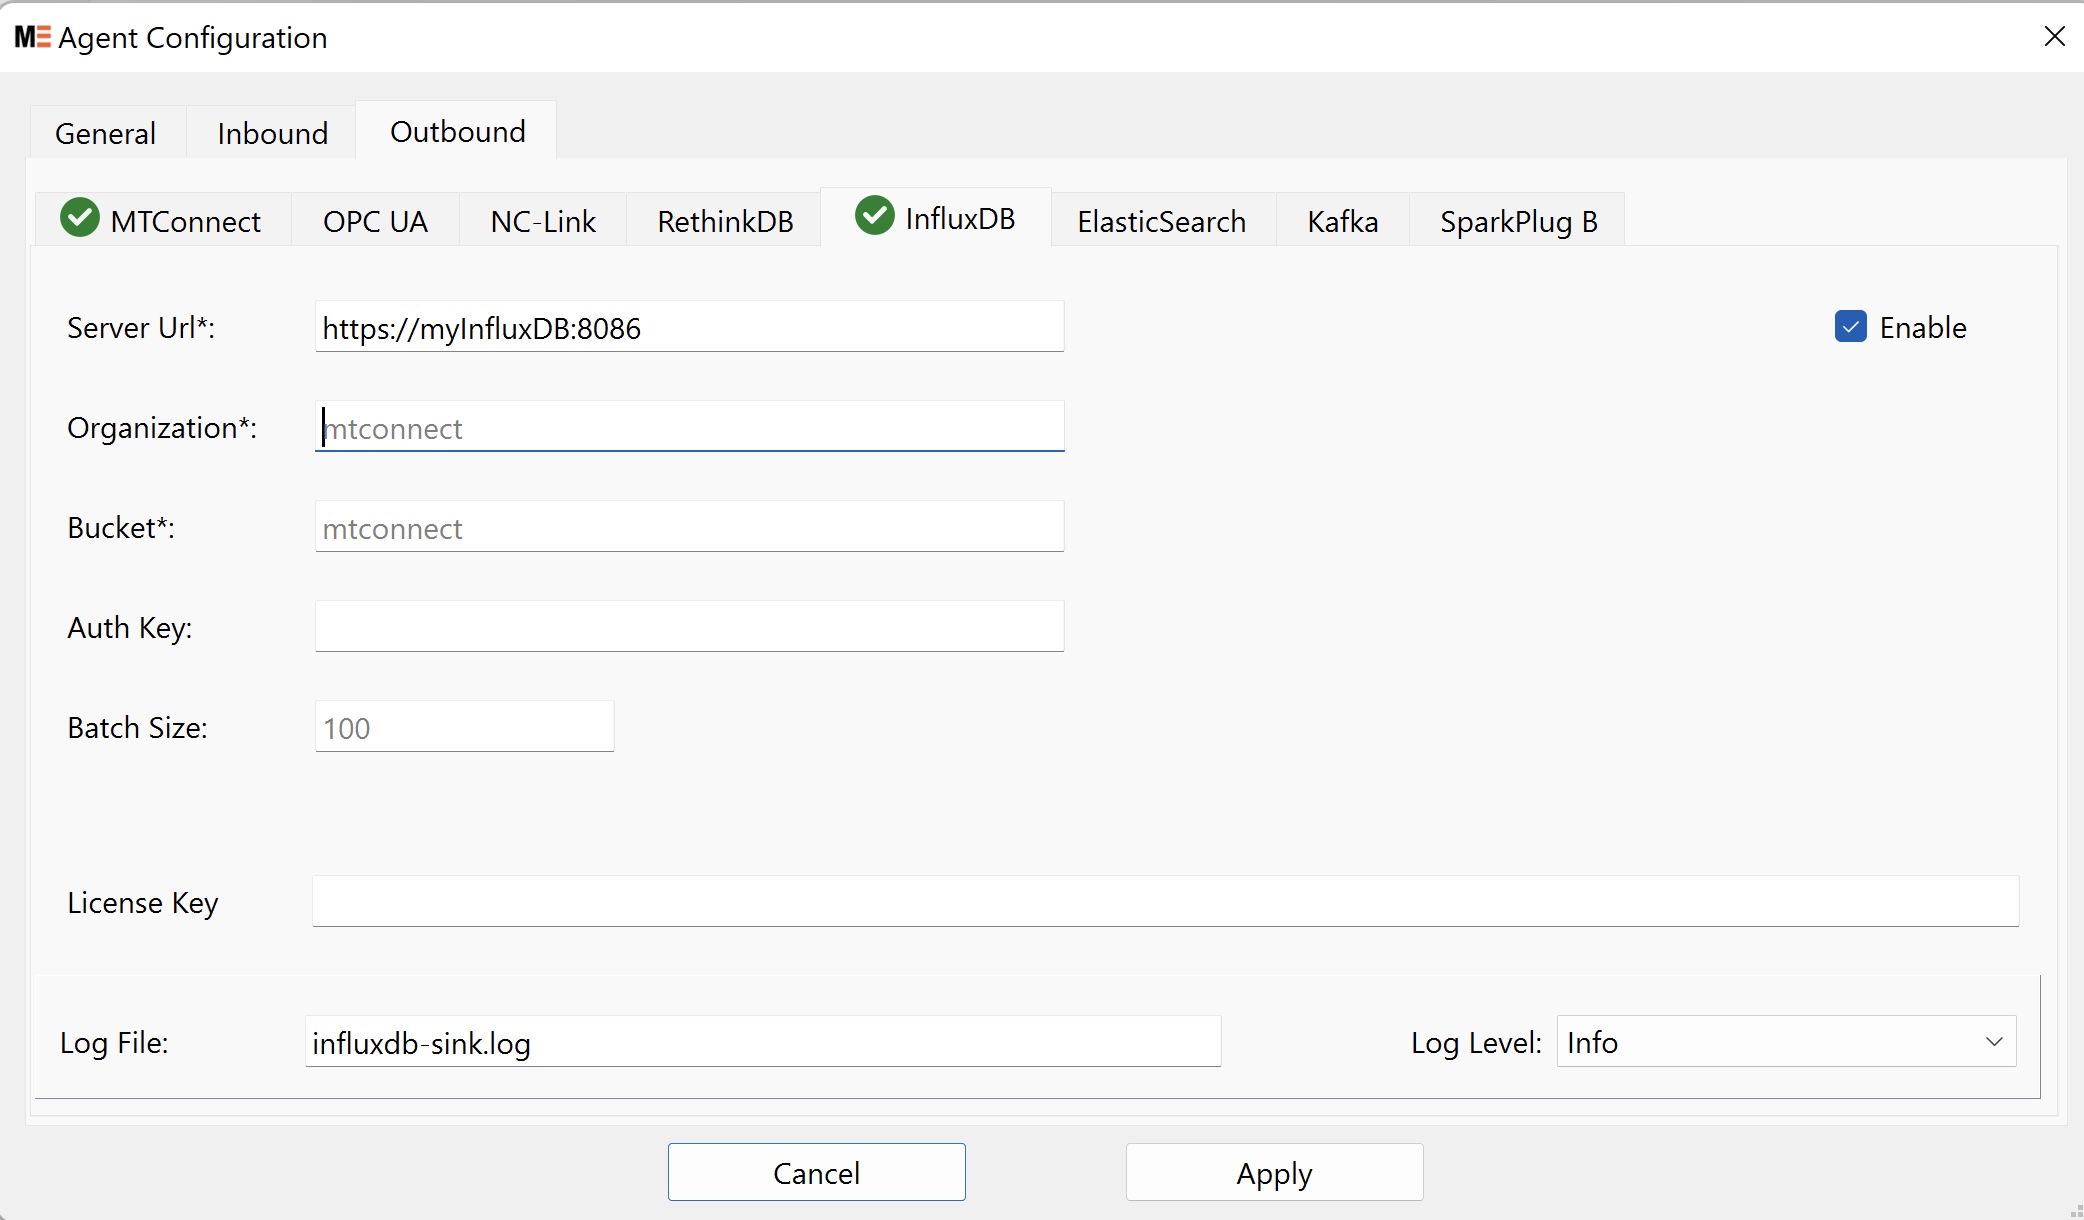
Server Url: The InfluxDB HTTP service's URLOrganization / Bucket: Specify the Organization and designated Bucket of the input data.Auth Key: InfluxDB's authorization key infoBatch Size: Specify # of records for each upload
Please visit the InfluxDB Times Series Data Platform website for setup info.
¶ Outbound - Elasticsearch Platform
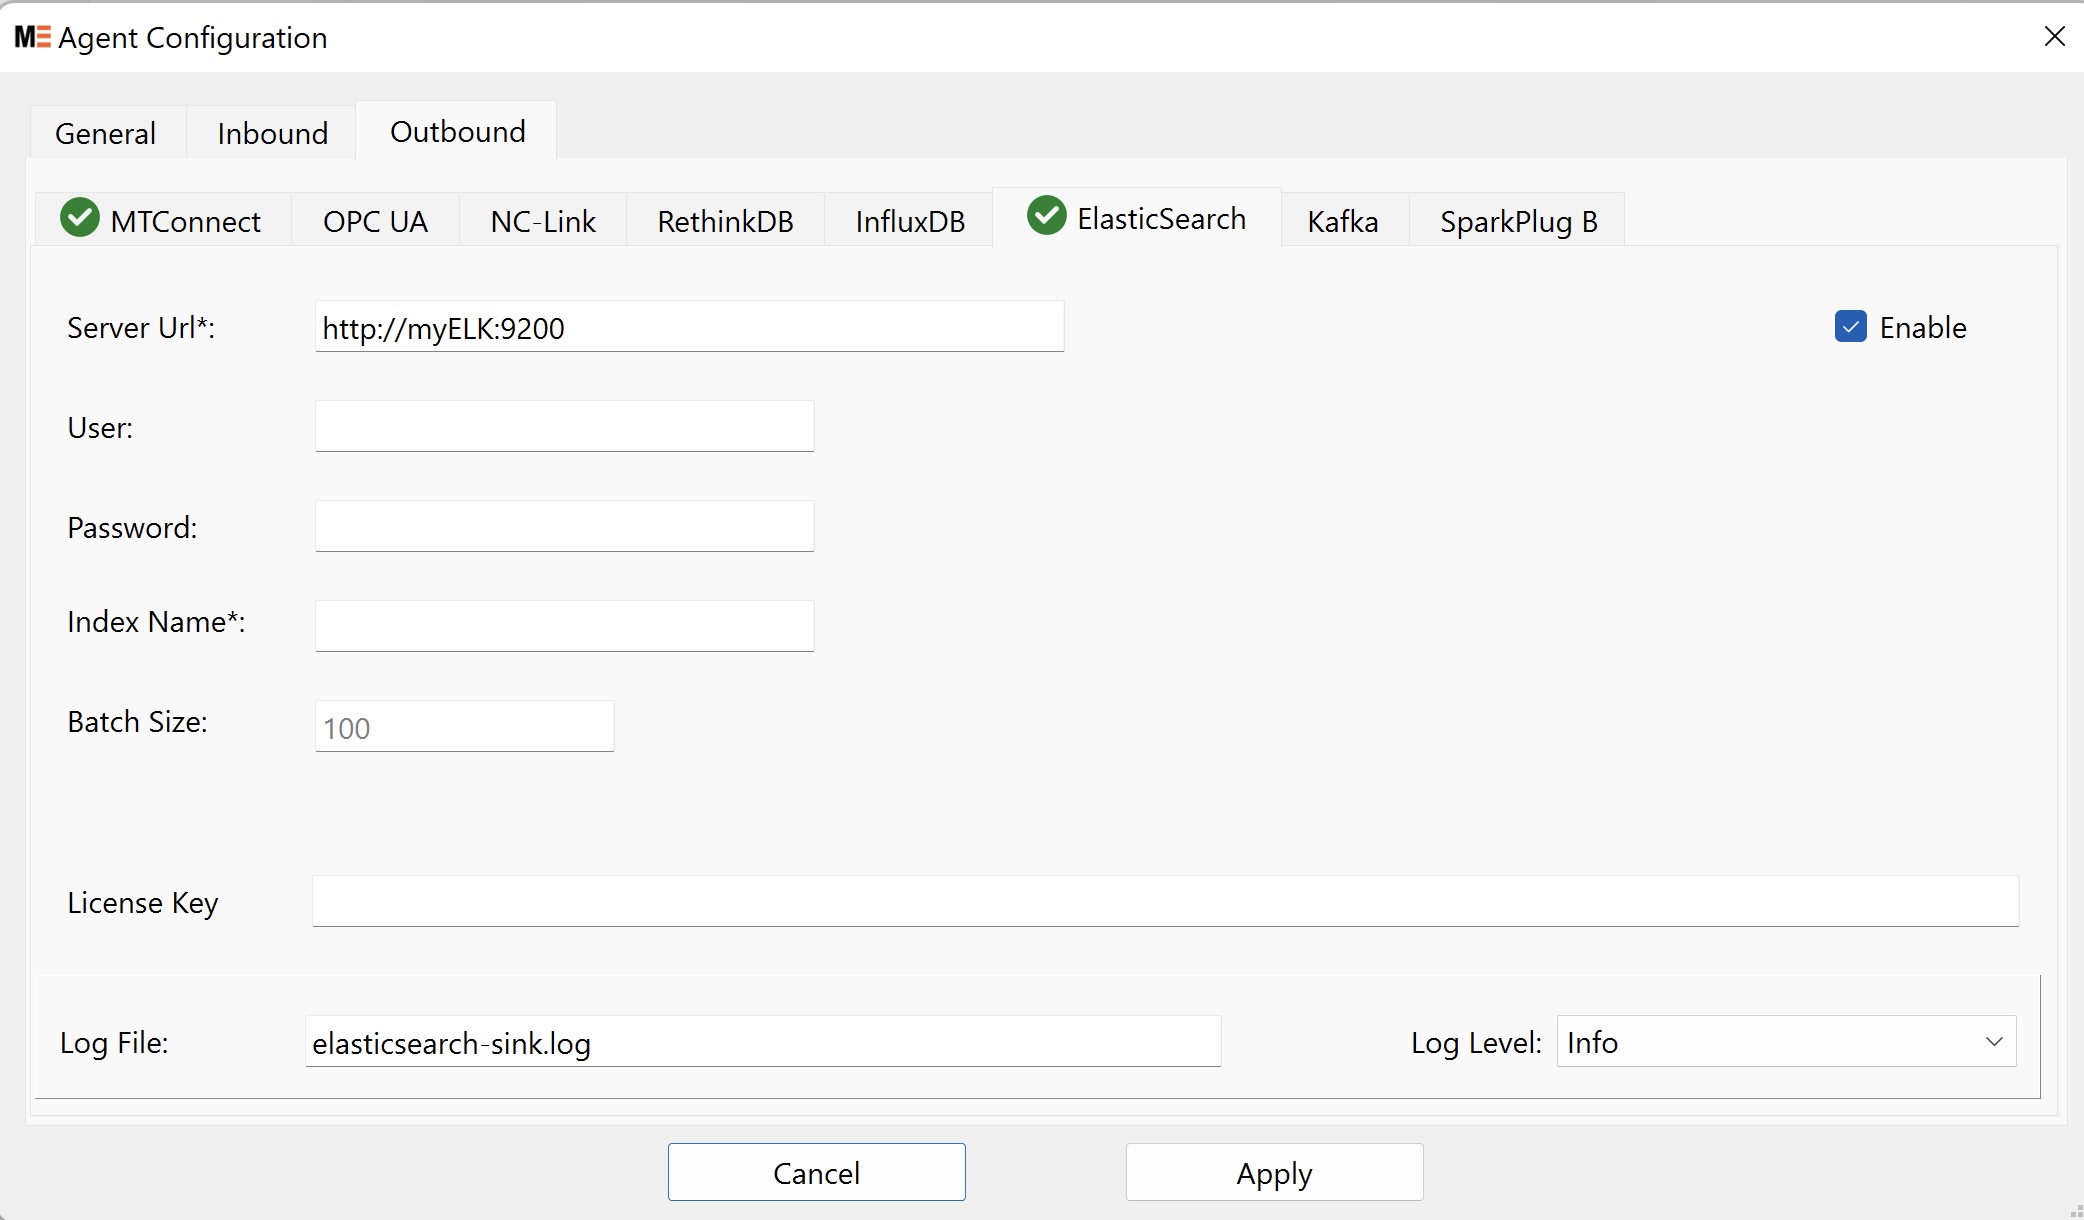
Server Url: Elasticsearch API service's URLUser/Password: Elasticsearch service login credential.Index Name: The index name for the bulk insert dataBatch Size: Specify # of records for each bulk insert.
Please visit the Elasticsearch Platform website for setup info.
¶ Outbound - Apache Kafka
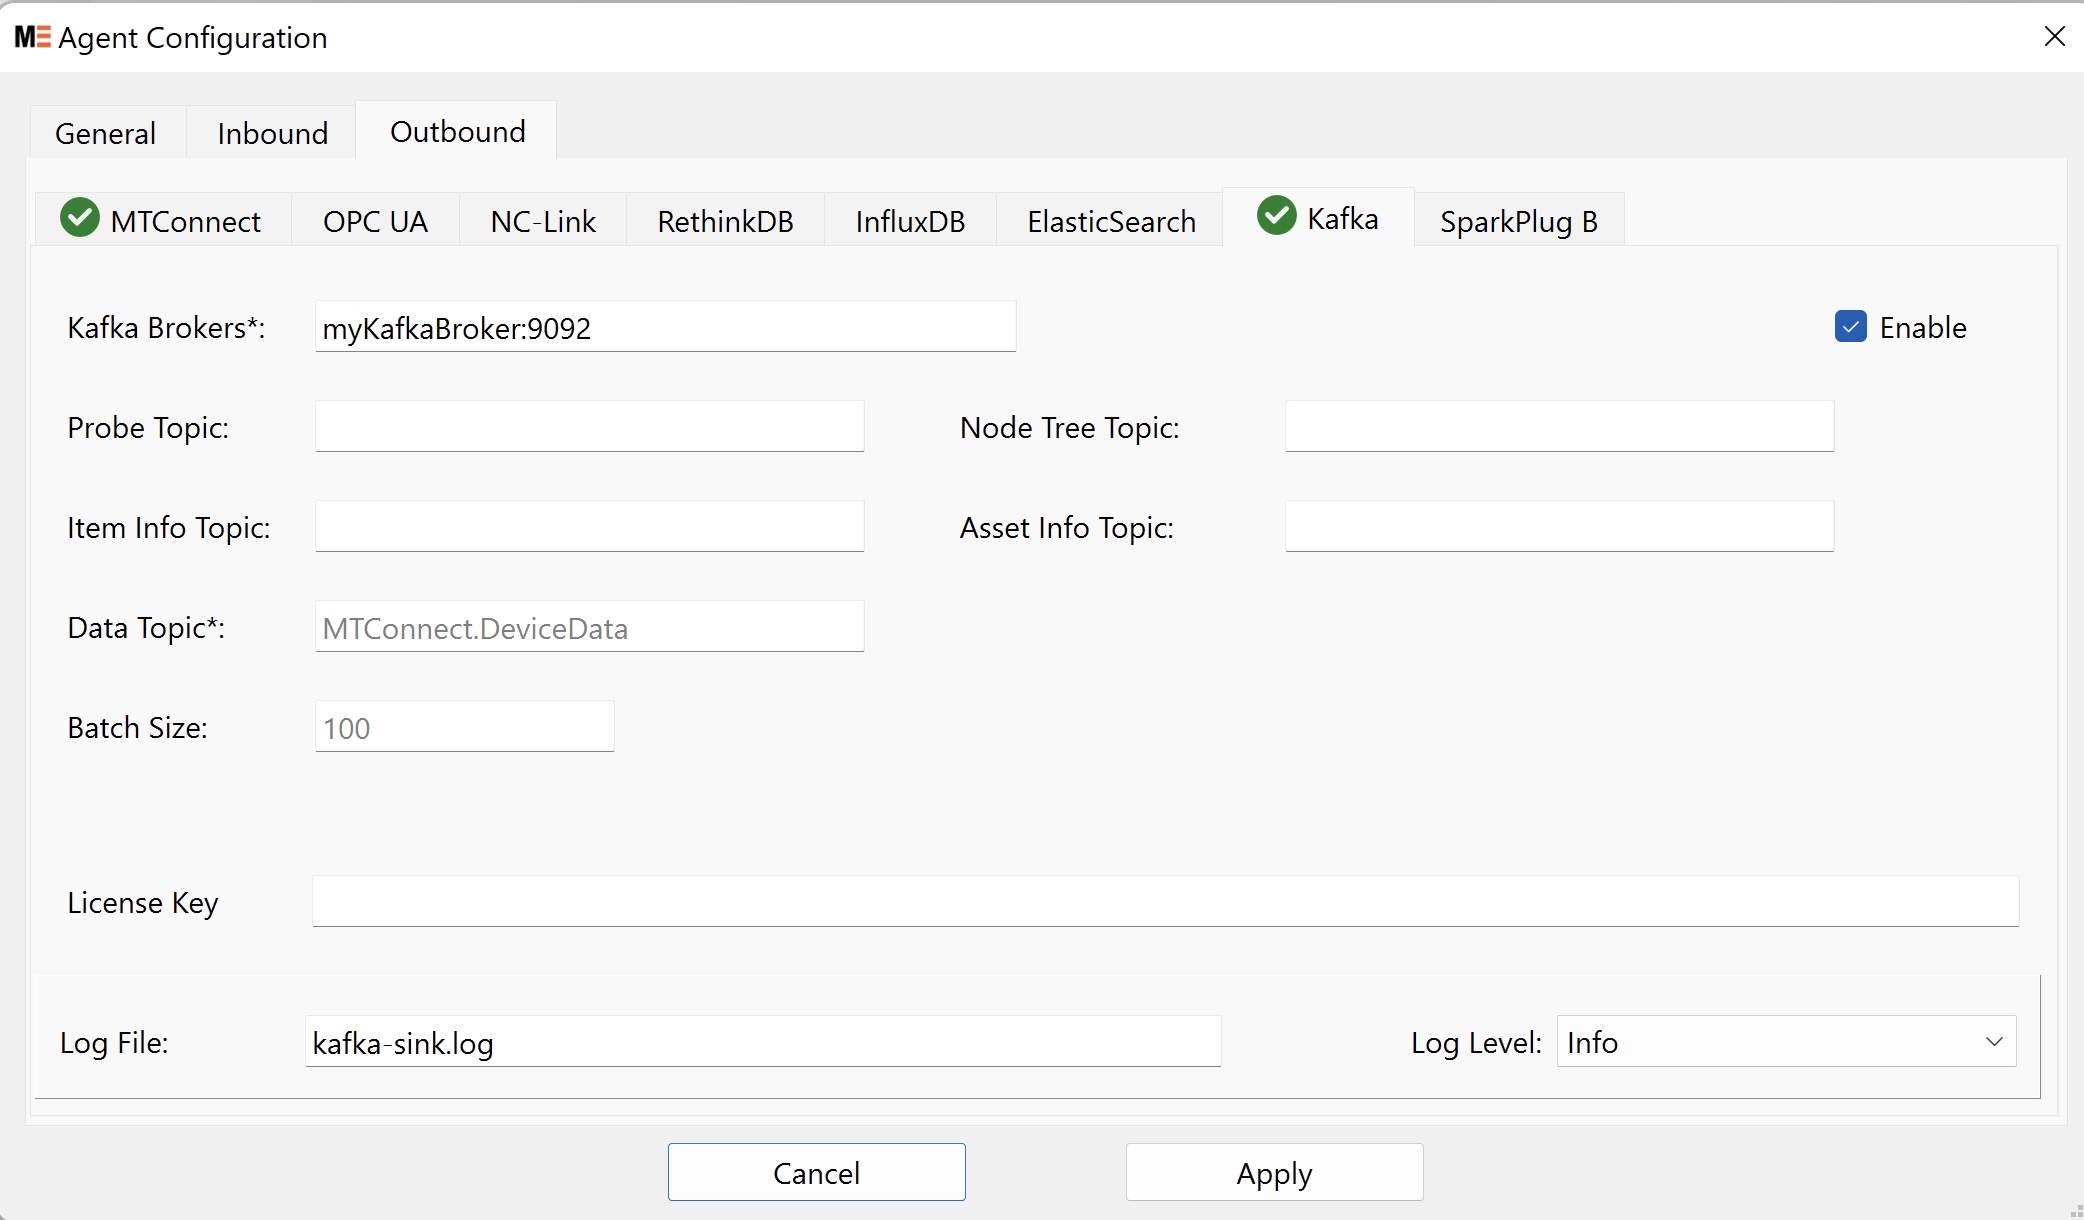
Kafka Brokers: One or more Kafka Brokers can be specified as <host>:<port #> and separated by comma.Probe Topic: The topic name on which the metadata of the Agent's machine is published.Node Tree Topic: The topic name for publishing the unified data selection tree constructed from the metadata.Item Info Topic: The topic name for publishing the type info for each data item.Asset Info Topic: The topic name for publishing the asset info in the Agent's data stream.Data Topic: The topic name for publishing the Samples, Events, and Condition real-time data.Batch Size: Specify how many data items are to be batched for each publication.
Please visit the Apache Kafka website for setup info.
¶ Outbound - Eclipse Sparkplug B (Beta)
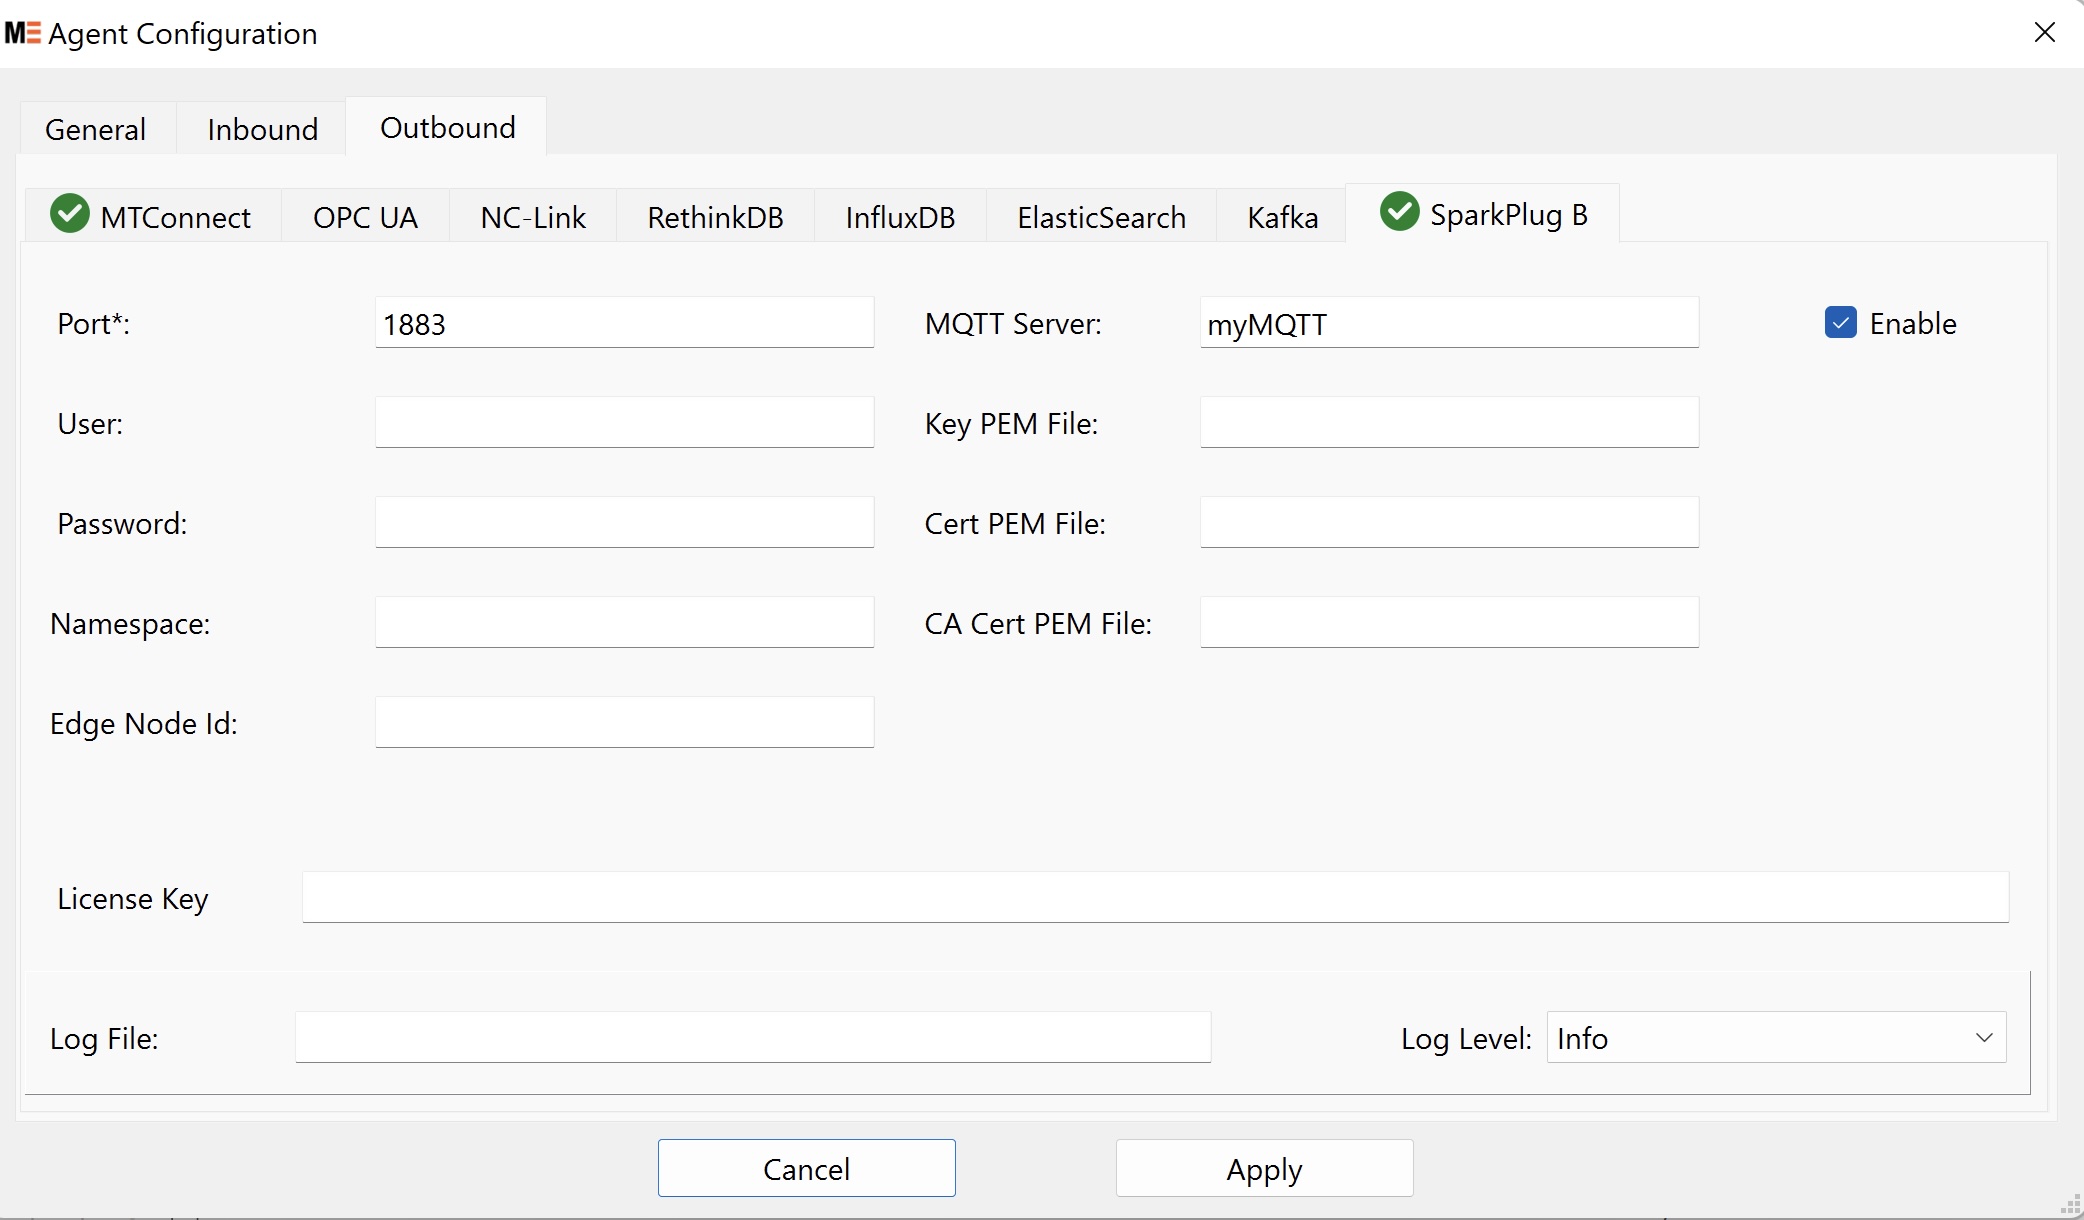
Port: MQTT server's port numberMQTT Server: MQTT server's hostnameUser/Password: User/Password login for the MQTT server.Namespace / Edge Node Id: The Ignition tags are constructed underEdge Nodes / <Namespace> / <Edge Node Id>Key/Cert File: Client certificate and its key file for the secured connection.CA Cert PEM File: CA certificate for the secured connection.
Please visit the Eclipse Sparkplug Working Group website for setup info.
¶ Outbound - MQTT
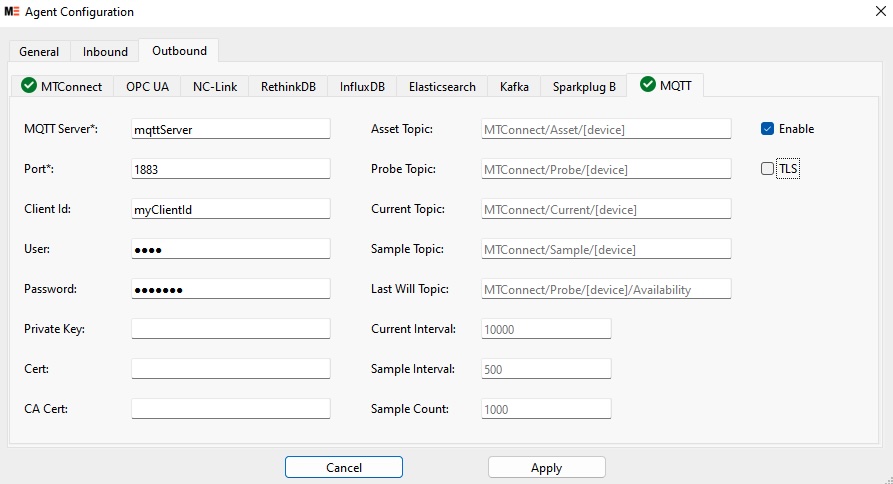
MQTT Server: MQTT server's hostnamePort: MQTT server's port numberClient Id: Client ID used in the connectionUser/Password: User/Password login for the MQTT server.Private Key/Cert File: Client certificate and its key file for the secured connection.CA Cert: CA certificate for the secured connection.Asset Topic- Prefix for the Assets. Default:MTConnect/Asset/[device]Current Topic- Prefix for the Current. Default:MTConnect/Current/[device]Probe Topic- Prefix for the Device Model topic. Default:MTConnect/Probe/[device]
Note: The
[device]will be replace with the uuid of each device. Other patterns can be created, for example:MTConnect/[device]/Probewill group by device instead of operation.
Sample Topic- Prefix for the Sample. Default:MTConnect/Current/[device]Last Will Topic- The topic used for the last will and testament for an agent. Default:MTConnect/Probe/[device]/Availability
Note: The value will be
AVAILABLEwhen the Agent is publishing and connected and will publishUNAVAILABLEwhen the agent disconnects from the broker.
Current Interval- The frequency of publishing currents. Acts like a keyframe in a video stream. Default: 10000msSample Interval- The frequency of publishing samples. Works the same way asintervalin the rest call. Group observations up and publish with the minimum interval given. If nothing is available, will wait until an observation arrives to publish. Default: 500msSample Count- The maximum number of observations to publish at one time. Default: 1000
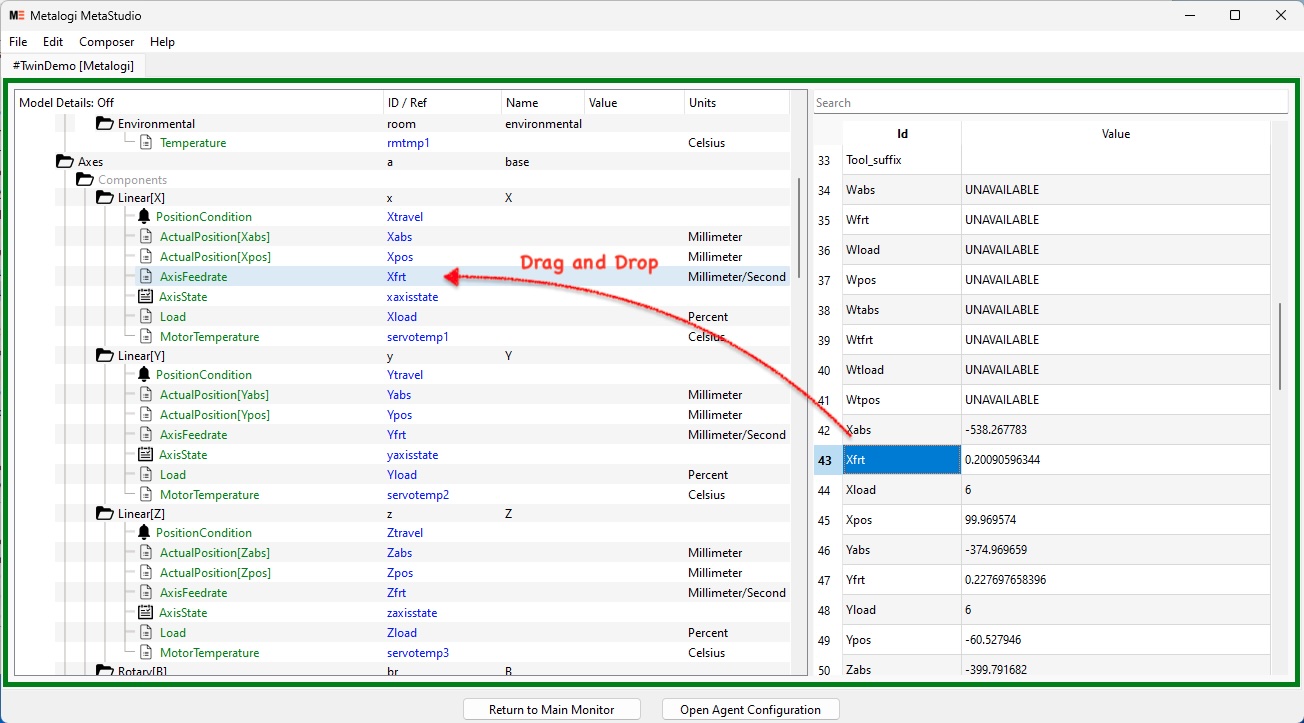
¶ Mapping Data from Adapters
After configuring inbound connection info, a left panel will show incoming traffic from this connection. You can drag and drop IDs from the left panel directly onto a data item's ID or Name. IDs starting with * are for Conditions. Others can be mapped to Samples or Events.
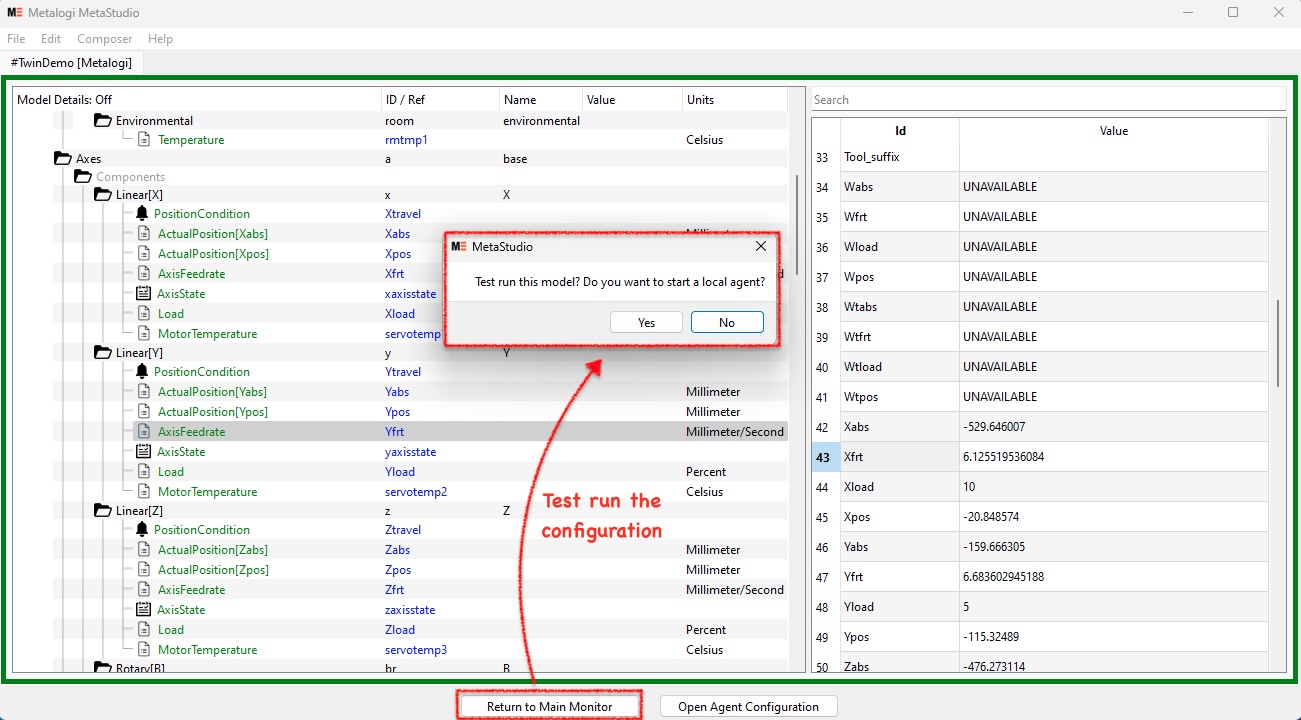
¶ Running MetaAgent and Testing the Configuration
After finishing agent configuration, you can test run your device model quickly by selecting Composer > Run Agent [Alt-R]. A local MetaAgent will start on a generated agent.cfg using the device model and inbound/outbound configuration.
If you make any agent configuration changes, you can restart the local MetaAgent by selecting Composer > Run Agent [Alt-R] again. Stop the local MetaAgent anytime by selecting Composer > Stop Agent [Alt-C].
Alternatively, you can diagnose any issues on starting/stopping the local MetaAgent process by selecting Composer > Show Local Agent Console [Alt-/] and viewing the output log:
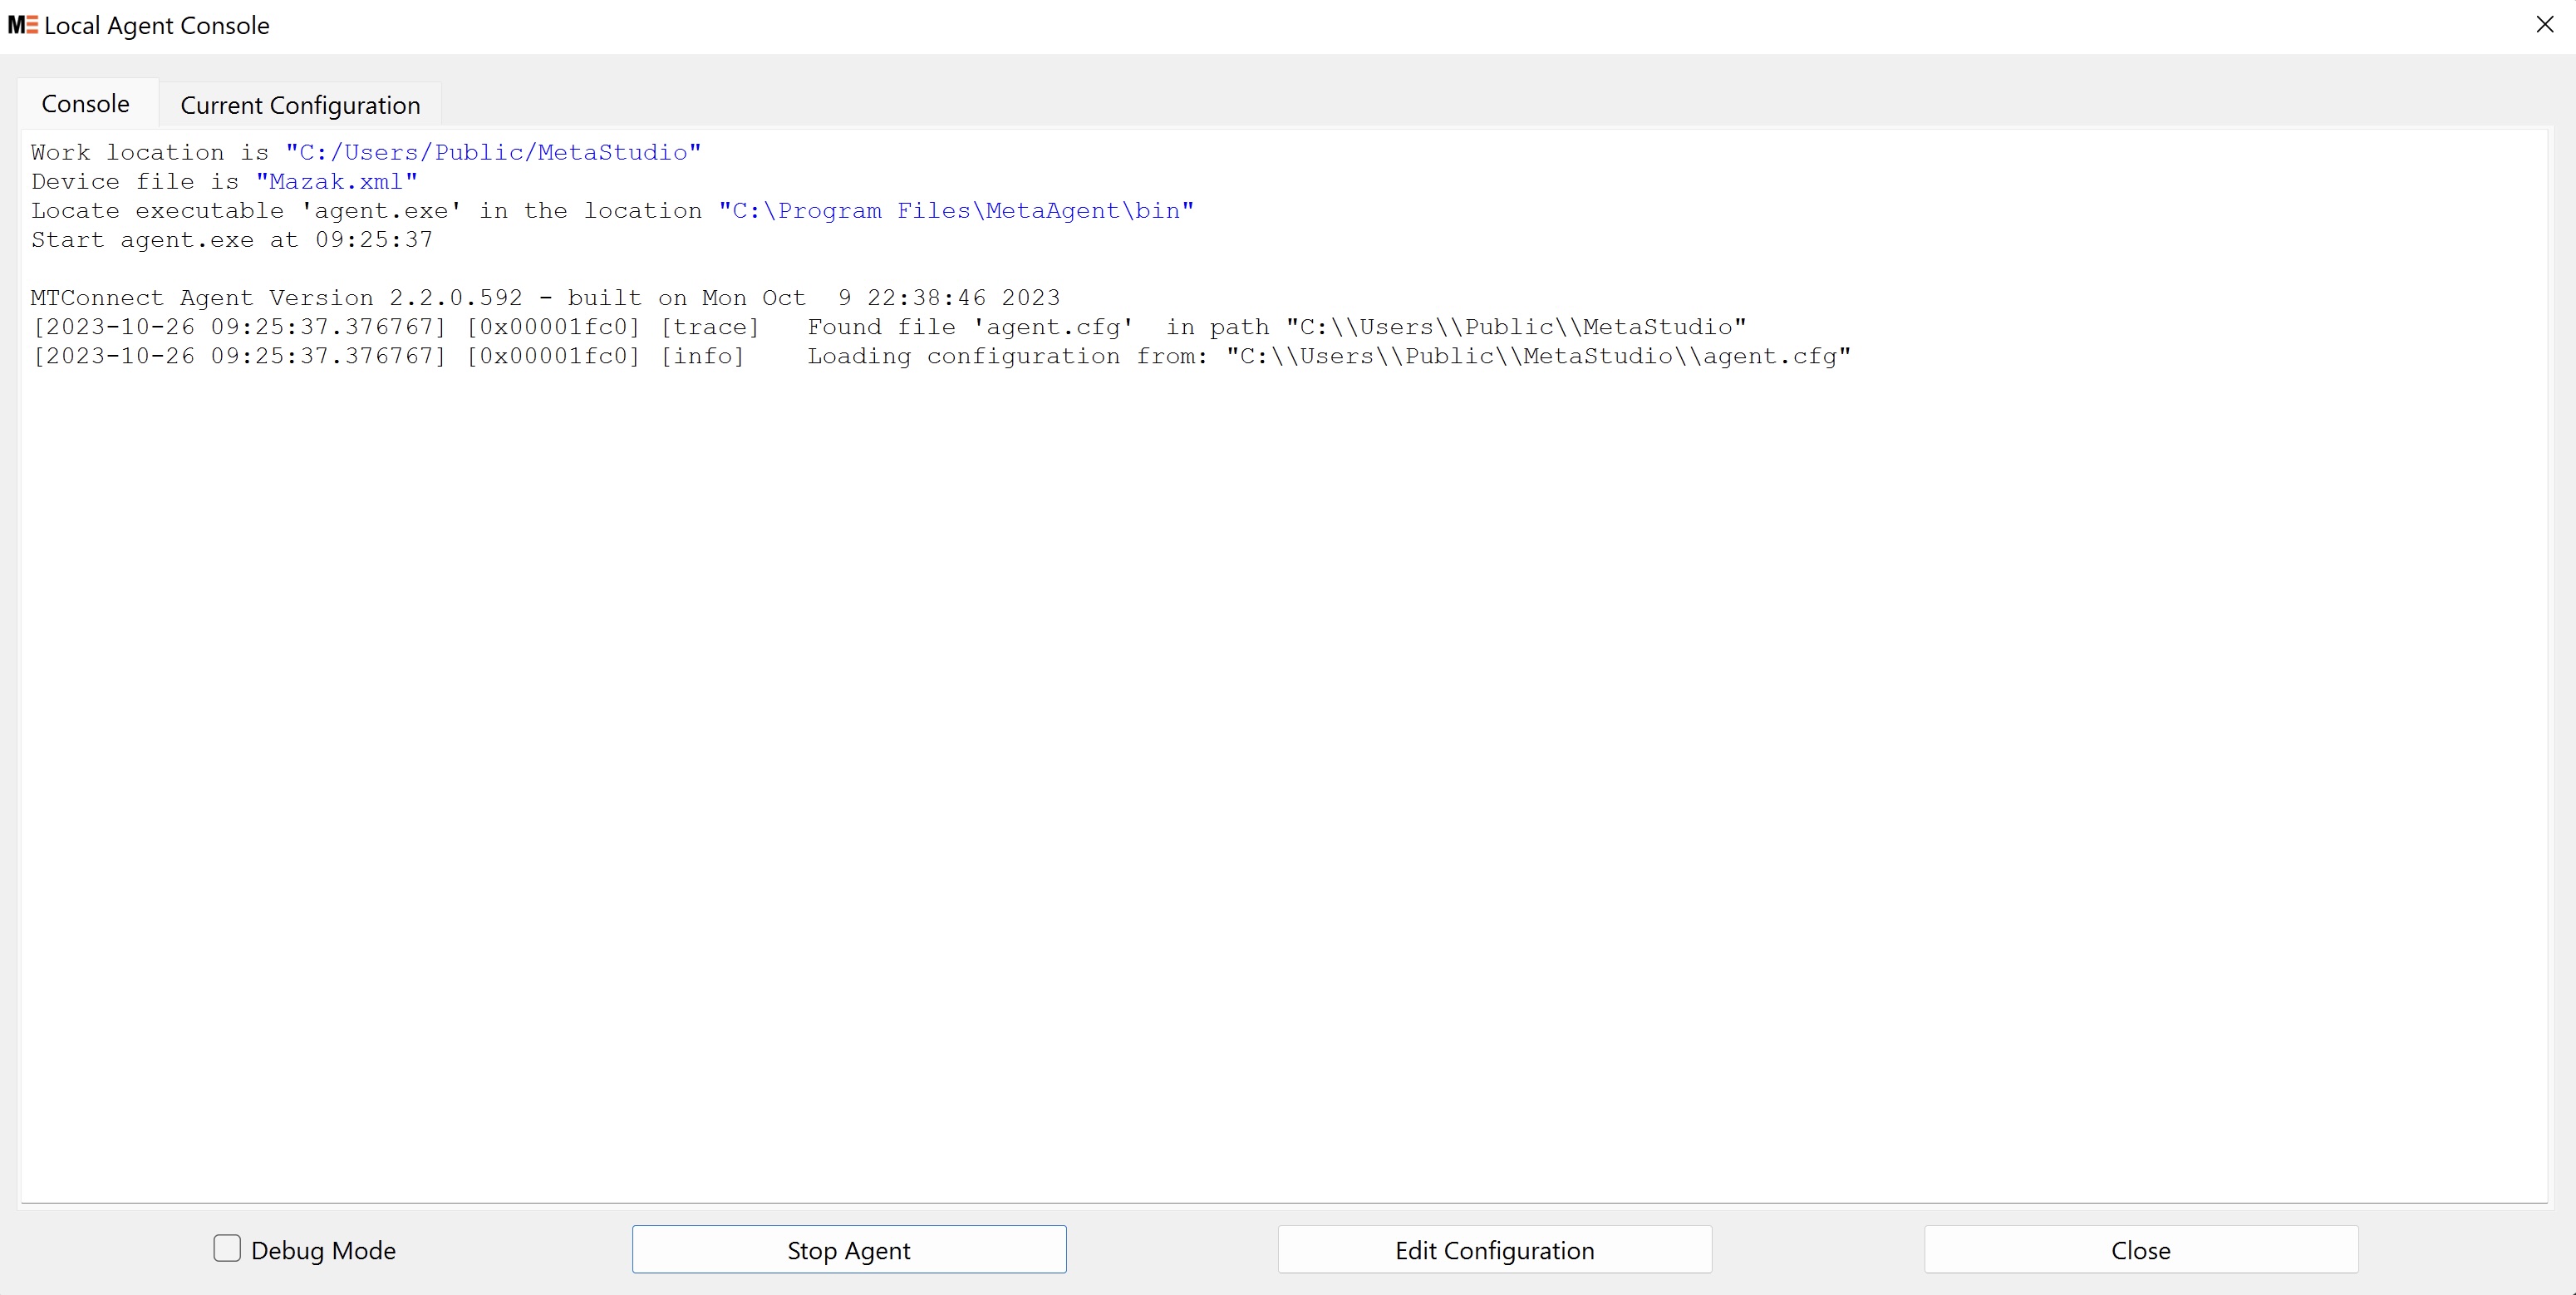
Check “Debug Mode” to turn on the agent's debug logging. Press “Edit Configuration” to update the agent's configuration.
Use UAExpert to check the OPC UA egress interface.
Use MQTTBox or another MQTT client tool to verify the NC-Link or any MQTT-related egress interface.
For MTConnect, you can view the live data by toggling between Device Monitor/Editor mode by selecting Composer > Switch to Monitor and Composer > Switch to Editor.
¶ Deploying the MetaAgent's Configuration
After completing the configuration and testing, all the agent's configuration is captured in the file agent.cfg and the device's meta info XML file. Copy these two files from the work location specified in the “General Configuration” under "Composer > Open Agent Configuration" to the production server. Finish up the installation by following the same MTConnect agent instructions here.
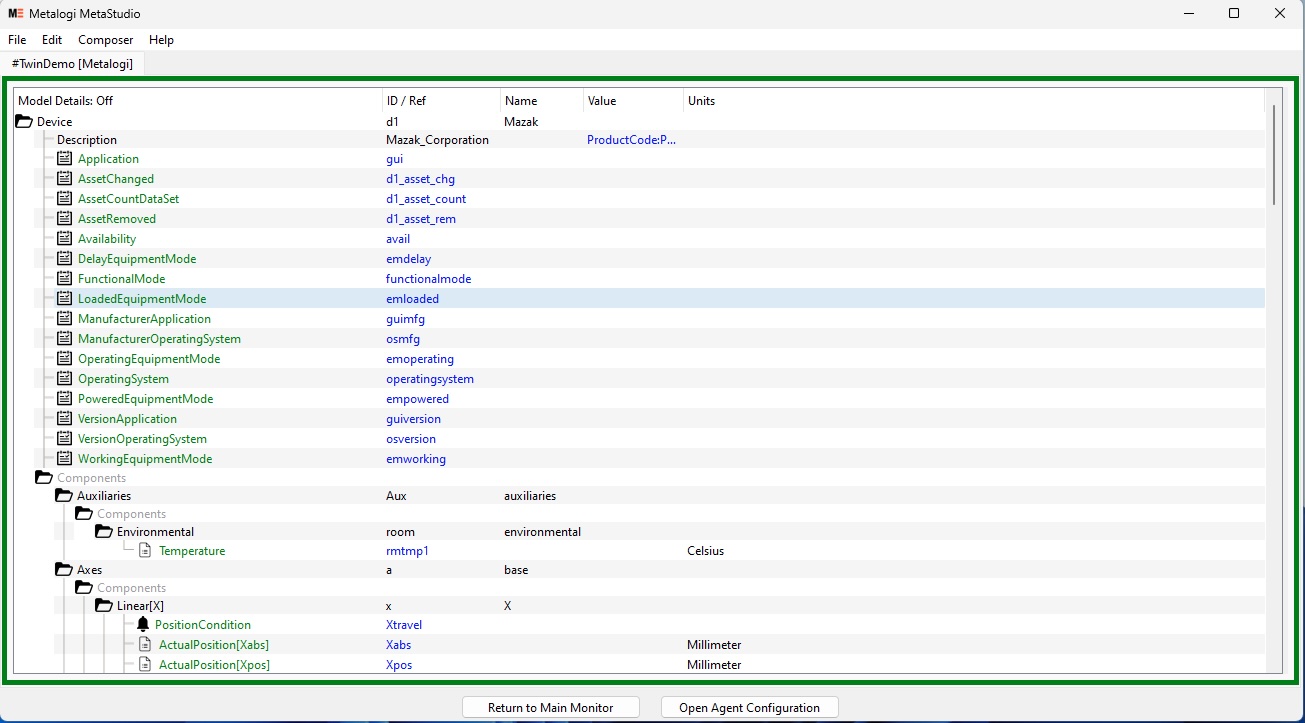
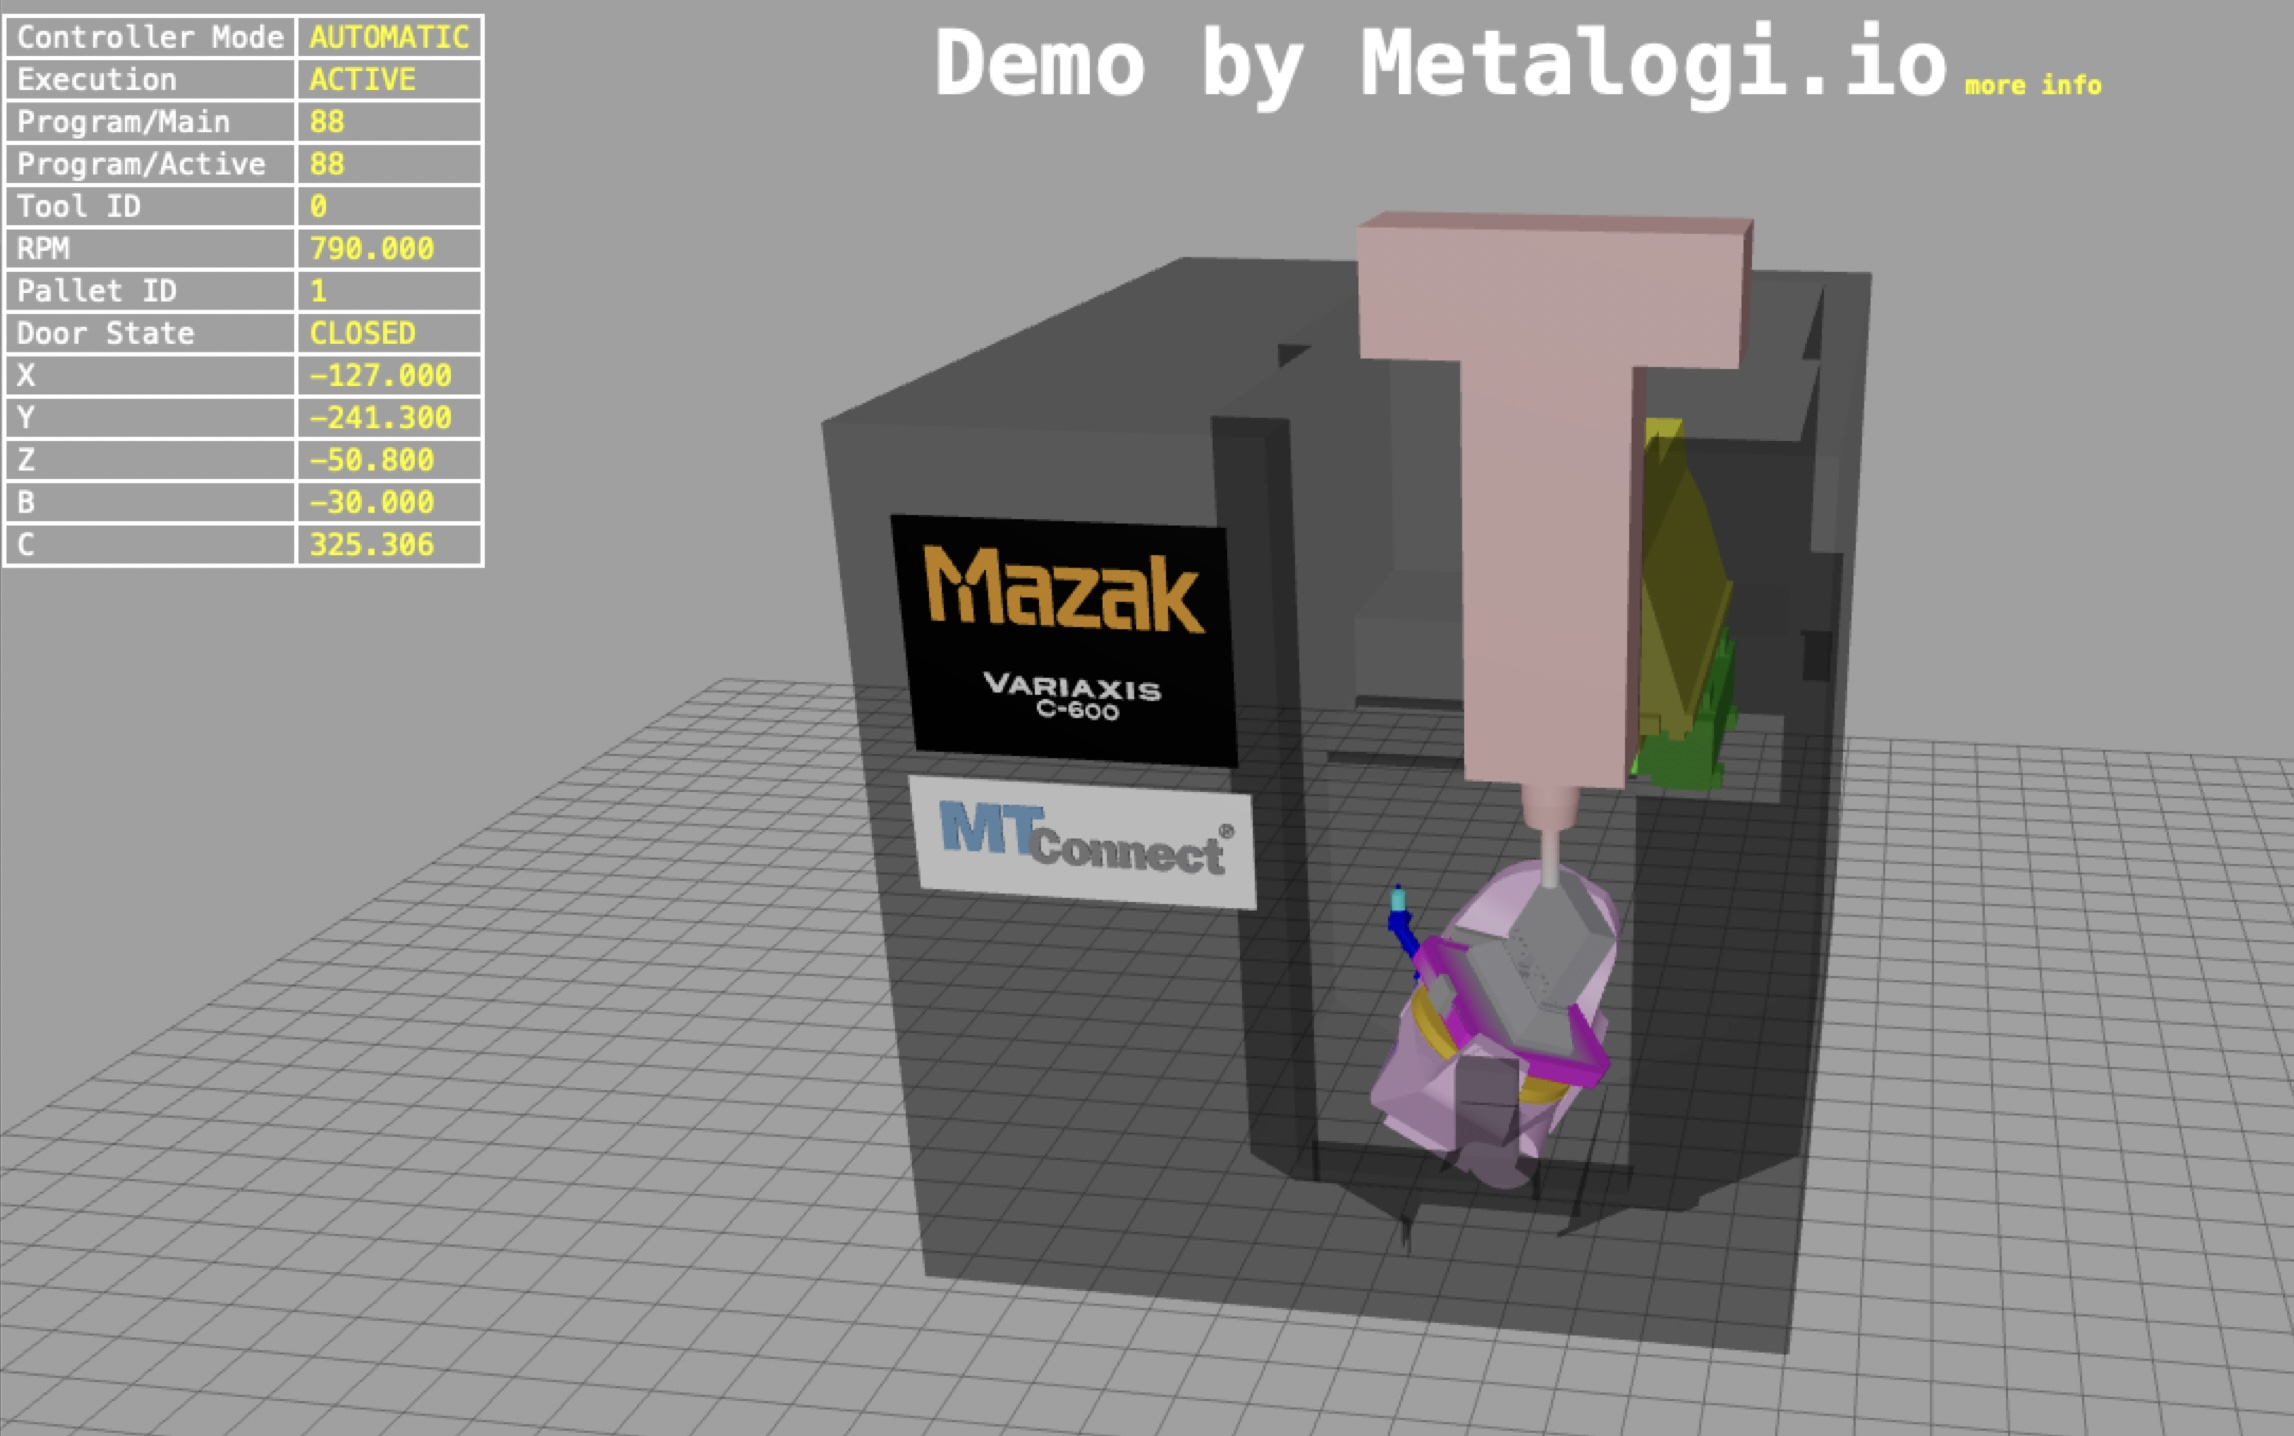
¶ Digital Twin Simulation
MTConnect 2.0 allows building kinematic models of machines by specifying the machines’ solid models and associating them with the motions of linear and rotary axes. With the proper setup, the MTConnect agent can display its kinetic motion simulation via the browser. An example is https://demo.metalogi.io/twin/index.html?device=Mazak.
All the required simulation parameters can be set up in the MTConnect device.xml. To facilitate the configuration process, MetaStudio supports the rendering of this simulation so the configuration changes can be tested iteratively.
¶ Additional Video Info
You may follow the setup instructions in this video as an example.
¶ Add/Update Solid Model Info
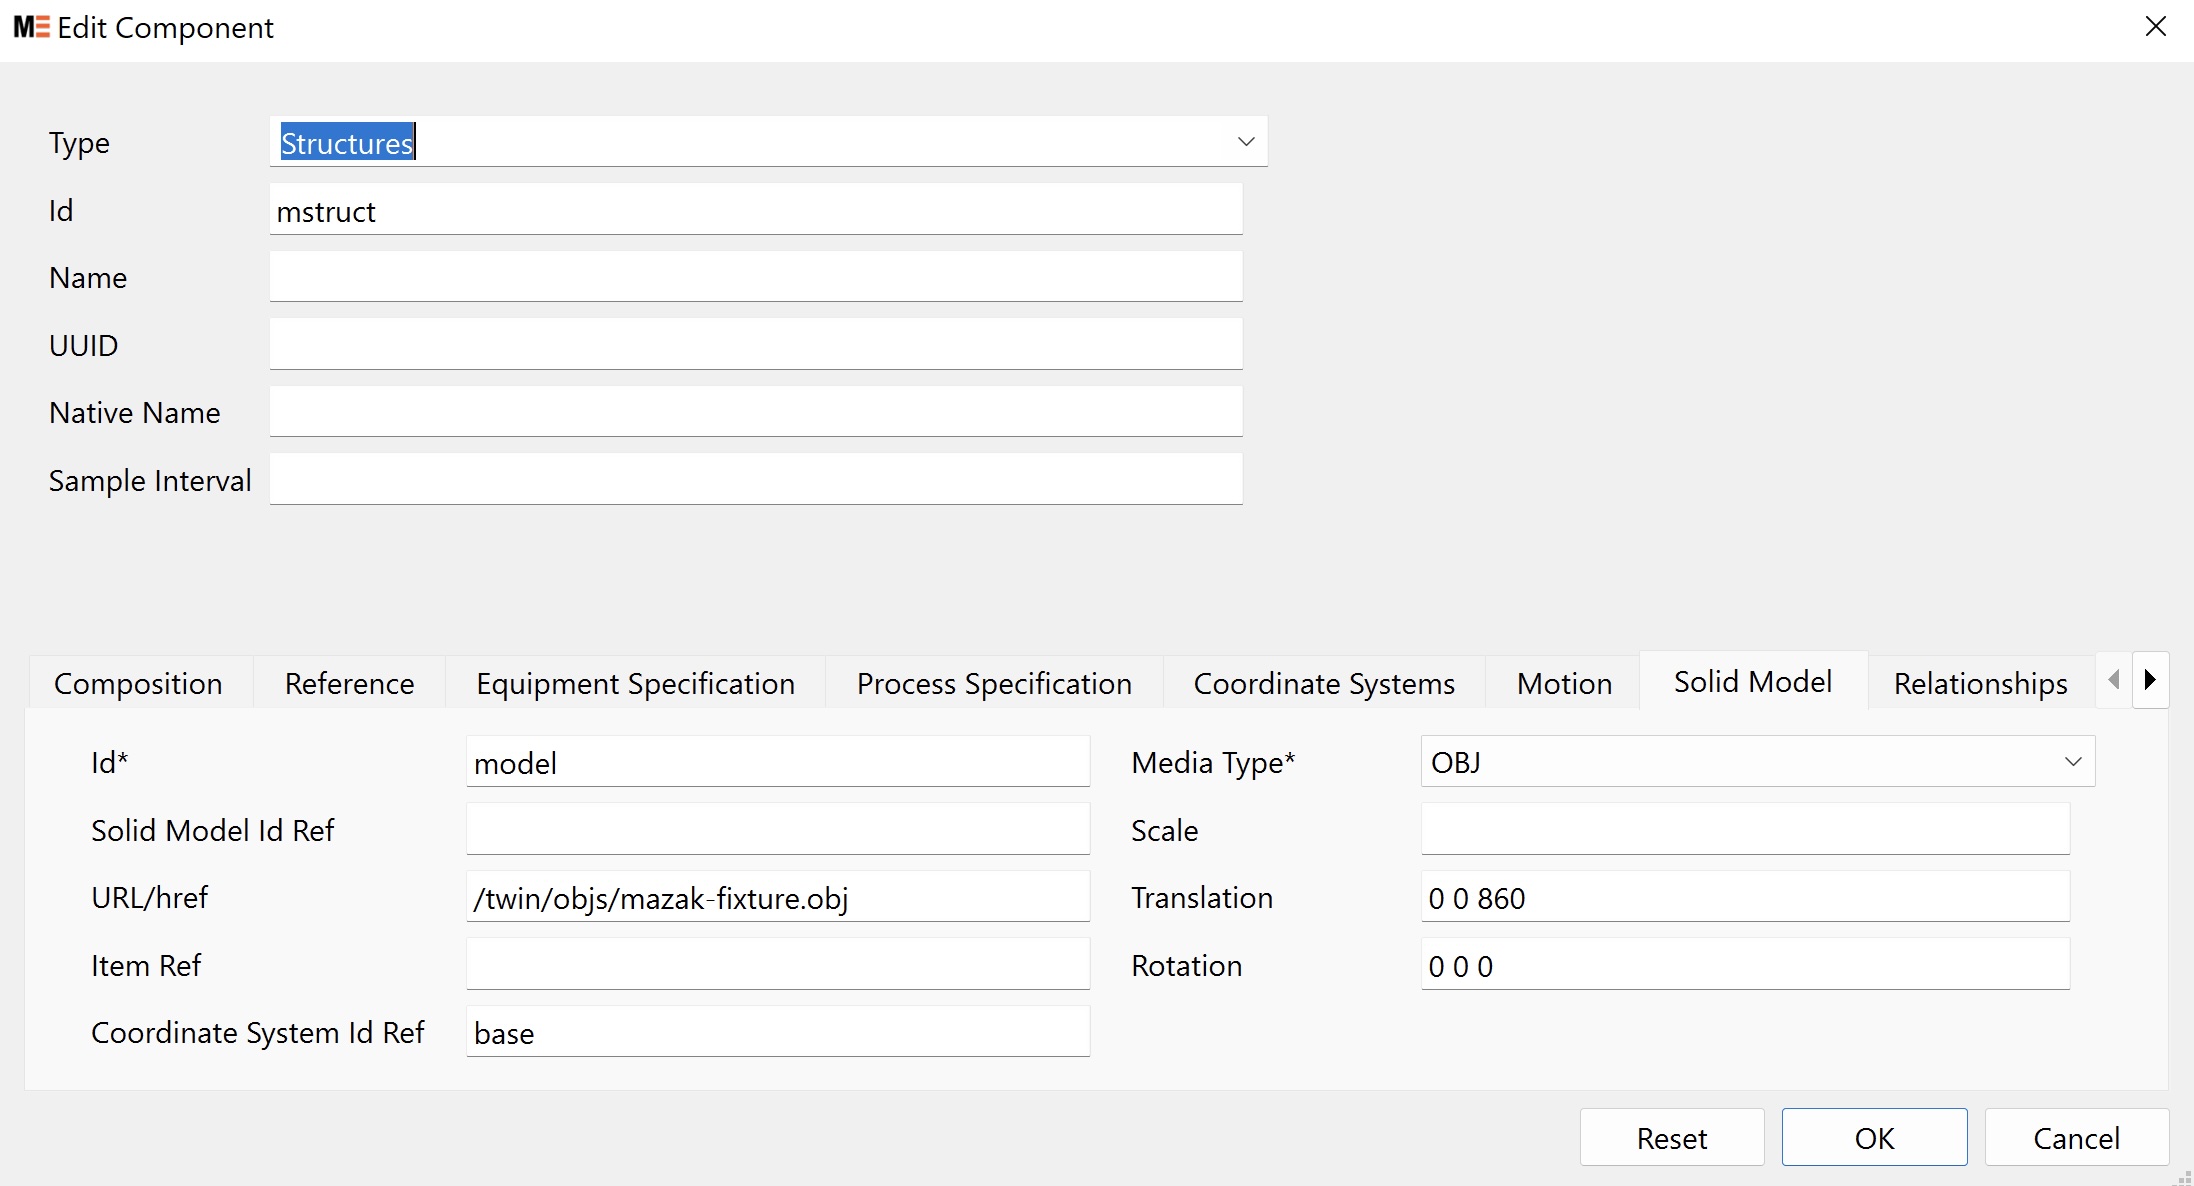
First, specify a 3D model that is provided by the MTConnect agent. In this example, it is under /twin/objs/mazak-fixture.obj. The coordinates and orientation for this 3D model can be adjusted by the field Translation and Rotation.
¶ Set up a Solid Model and Relationship to Links
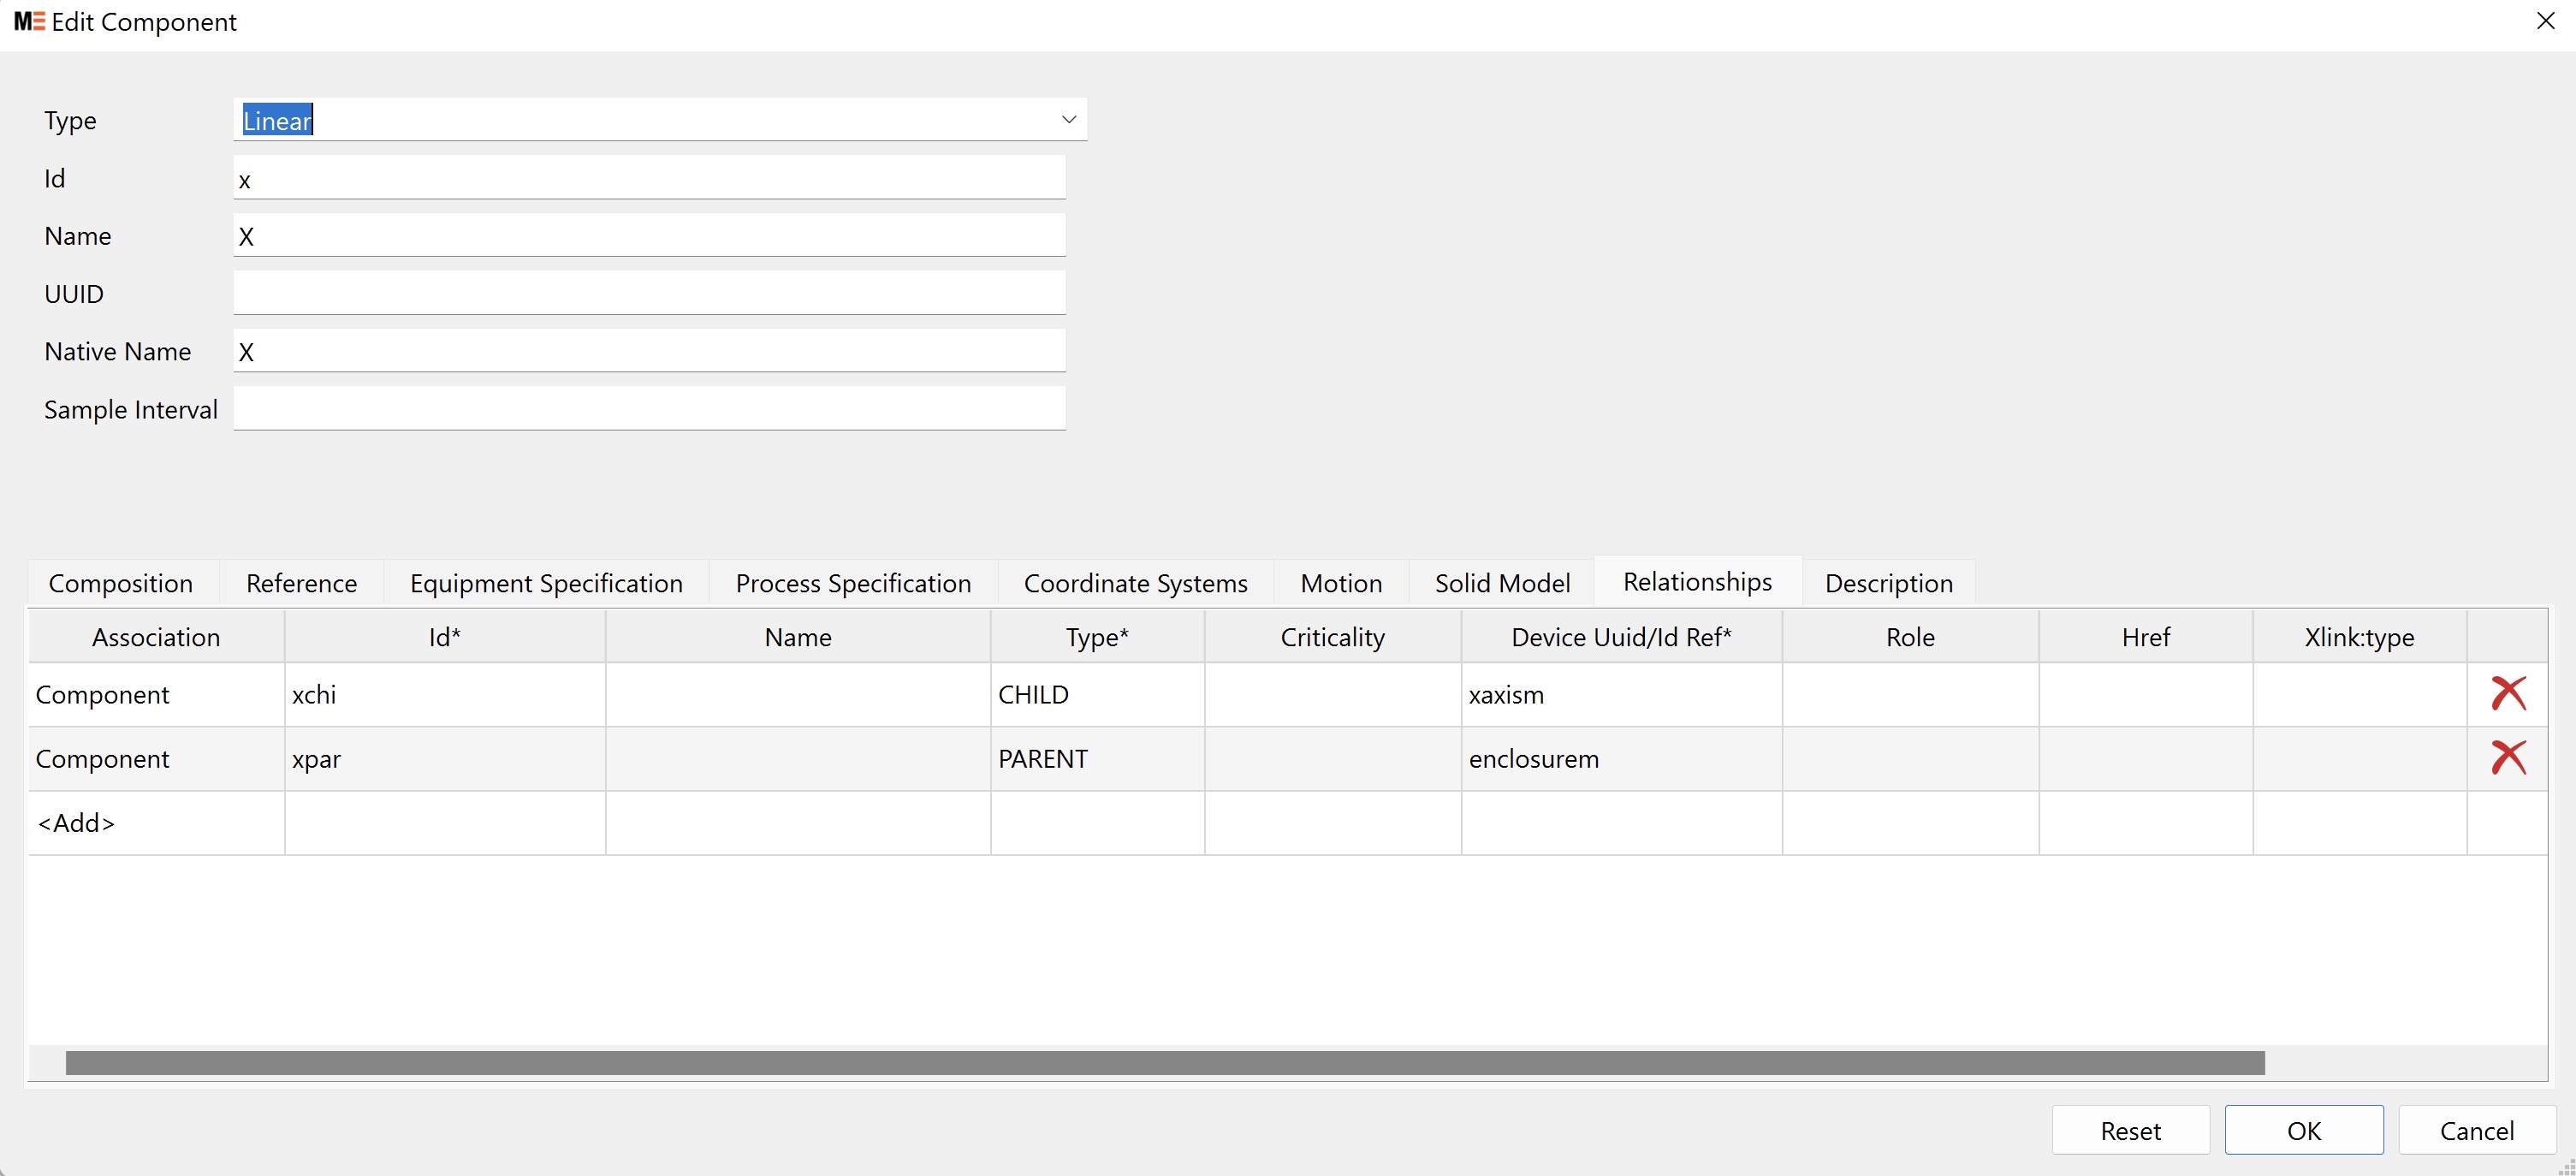
For the axis components, associate the components in the 3D model and their relationship.
¶ Associate Links with Axis Motions
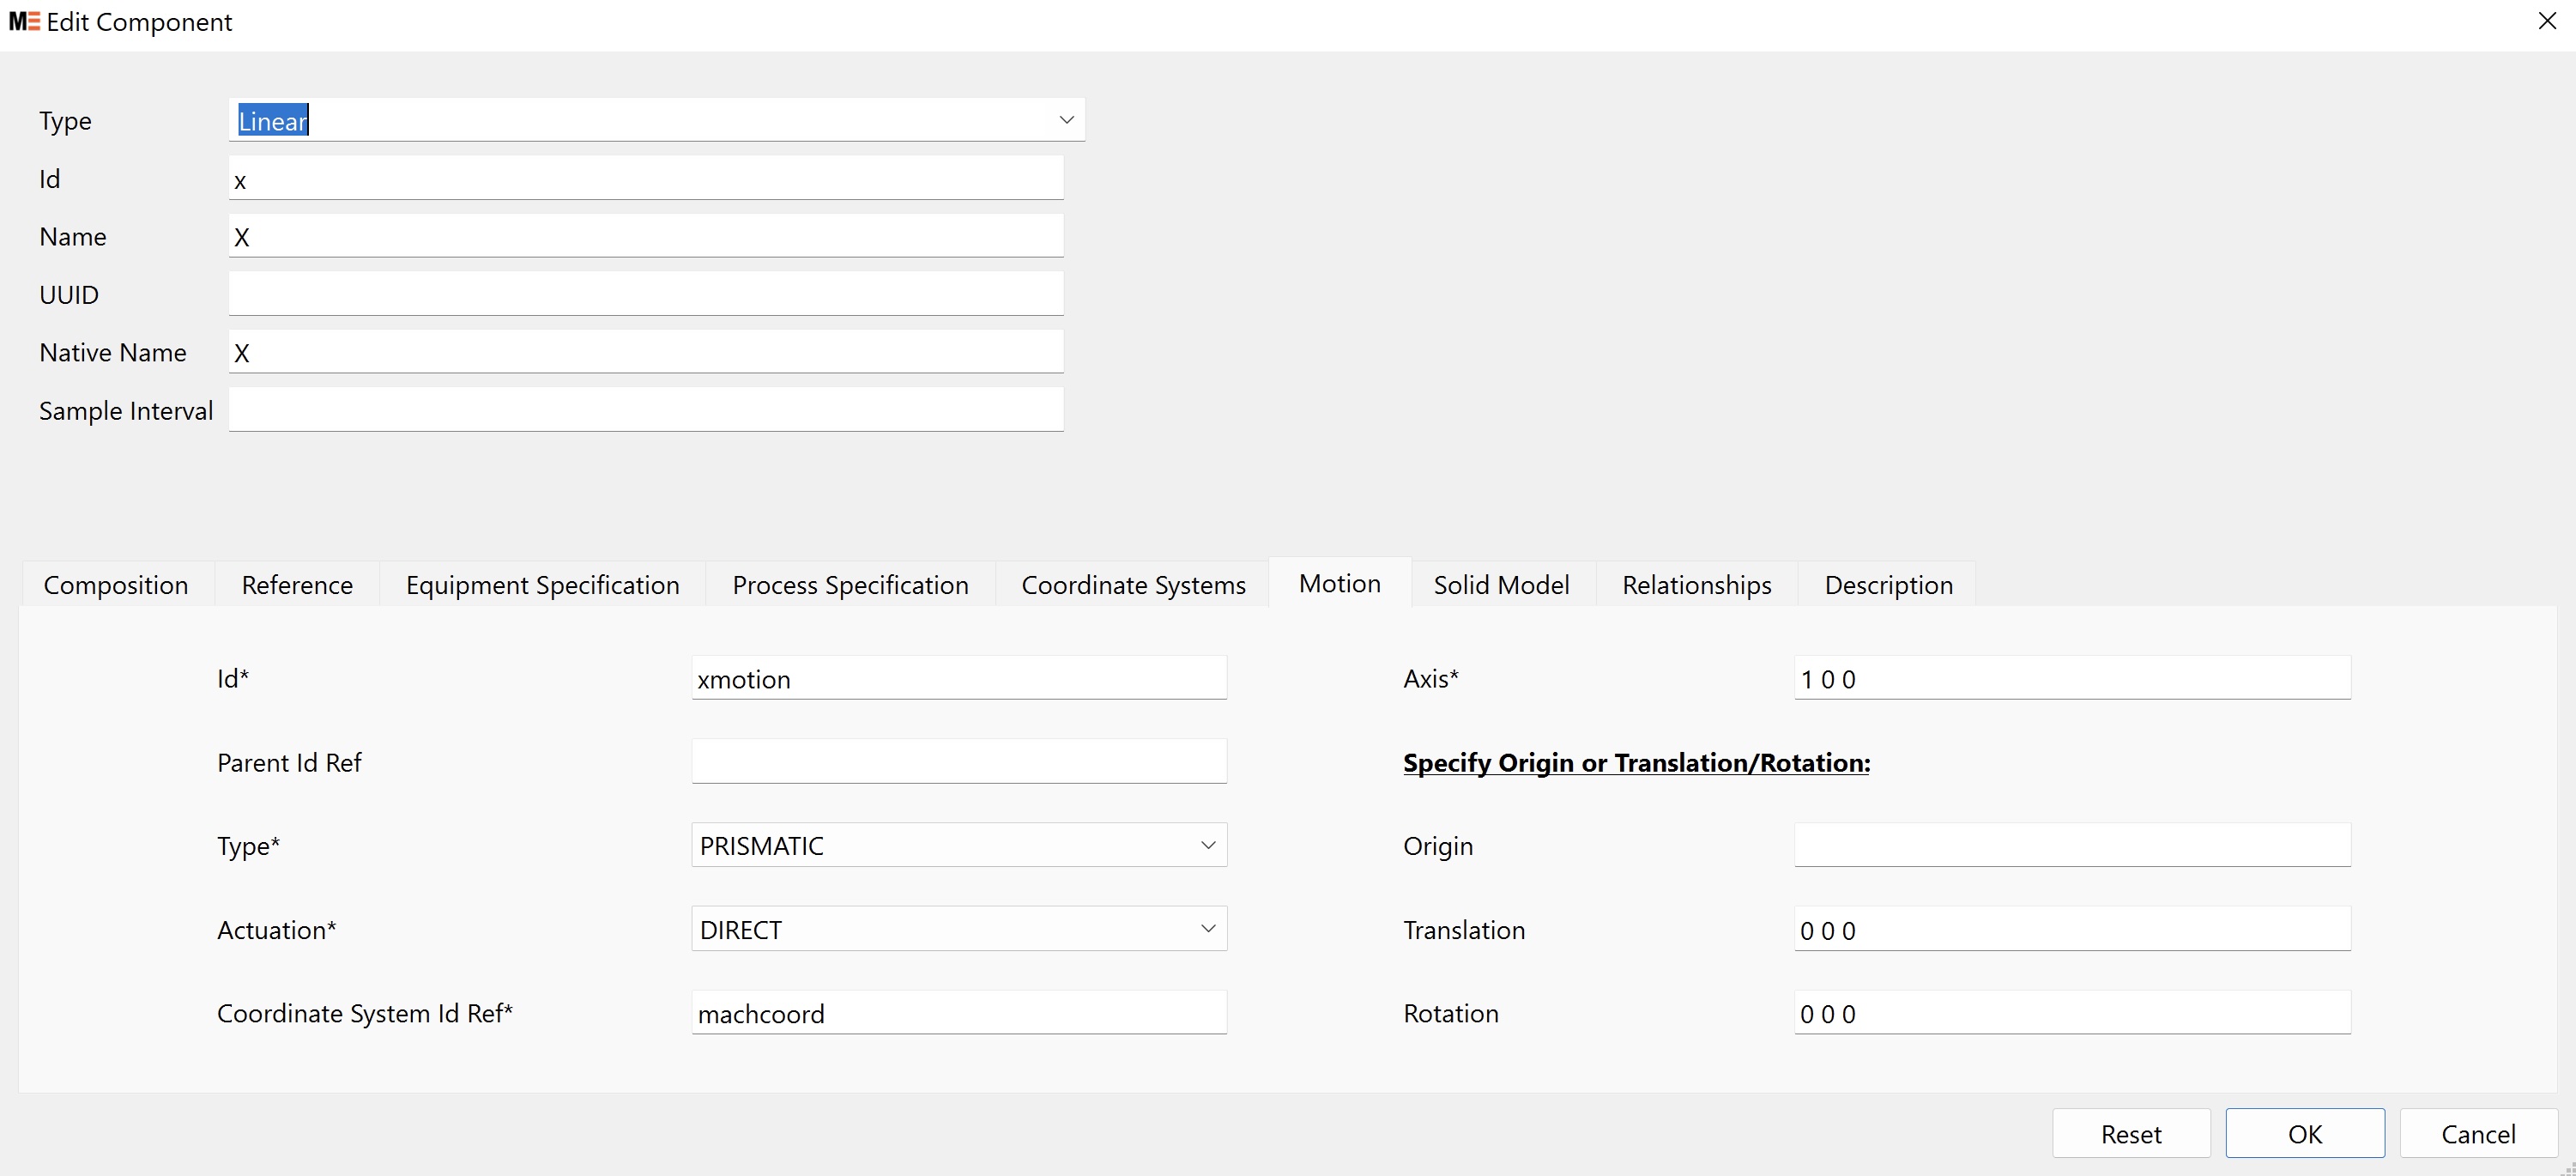
Also for the axis components, specify the machine coordinate, motion type, and Axis direction.
¶ Test the Simulation Configuration
After making any changes, select Composer > Run Agent to restart the local agent to pick up the changes. Then select Monitor > Display DigitalTwin Model to show the device’s simulation